Published
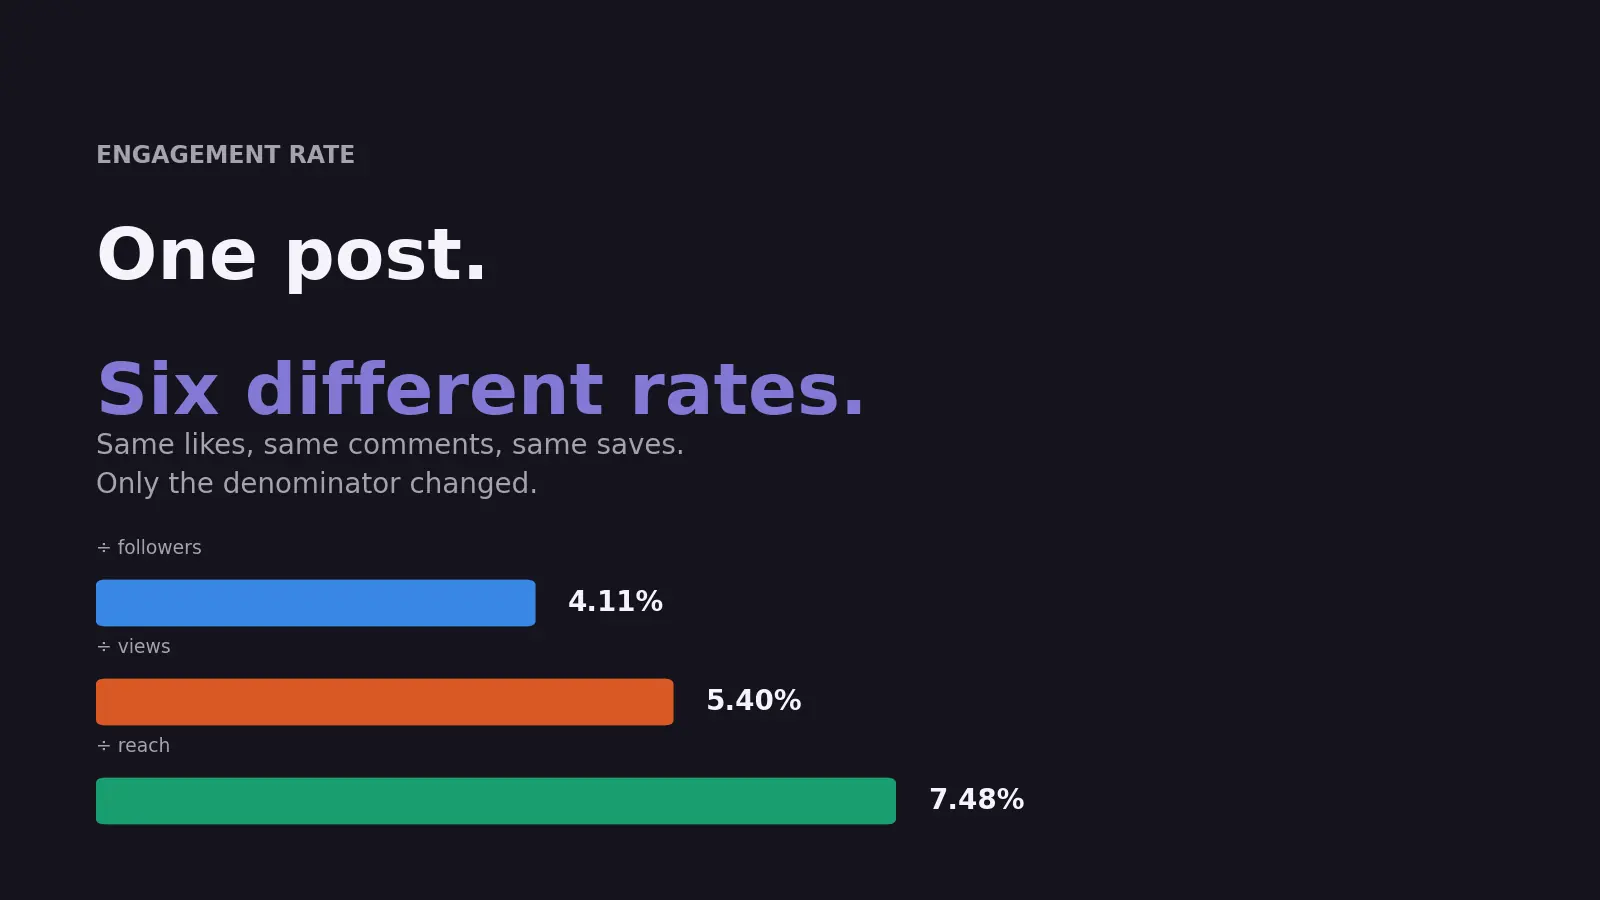
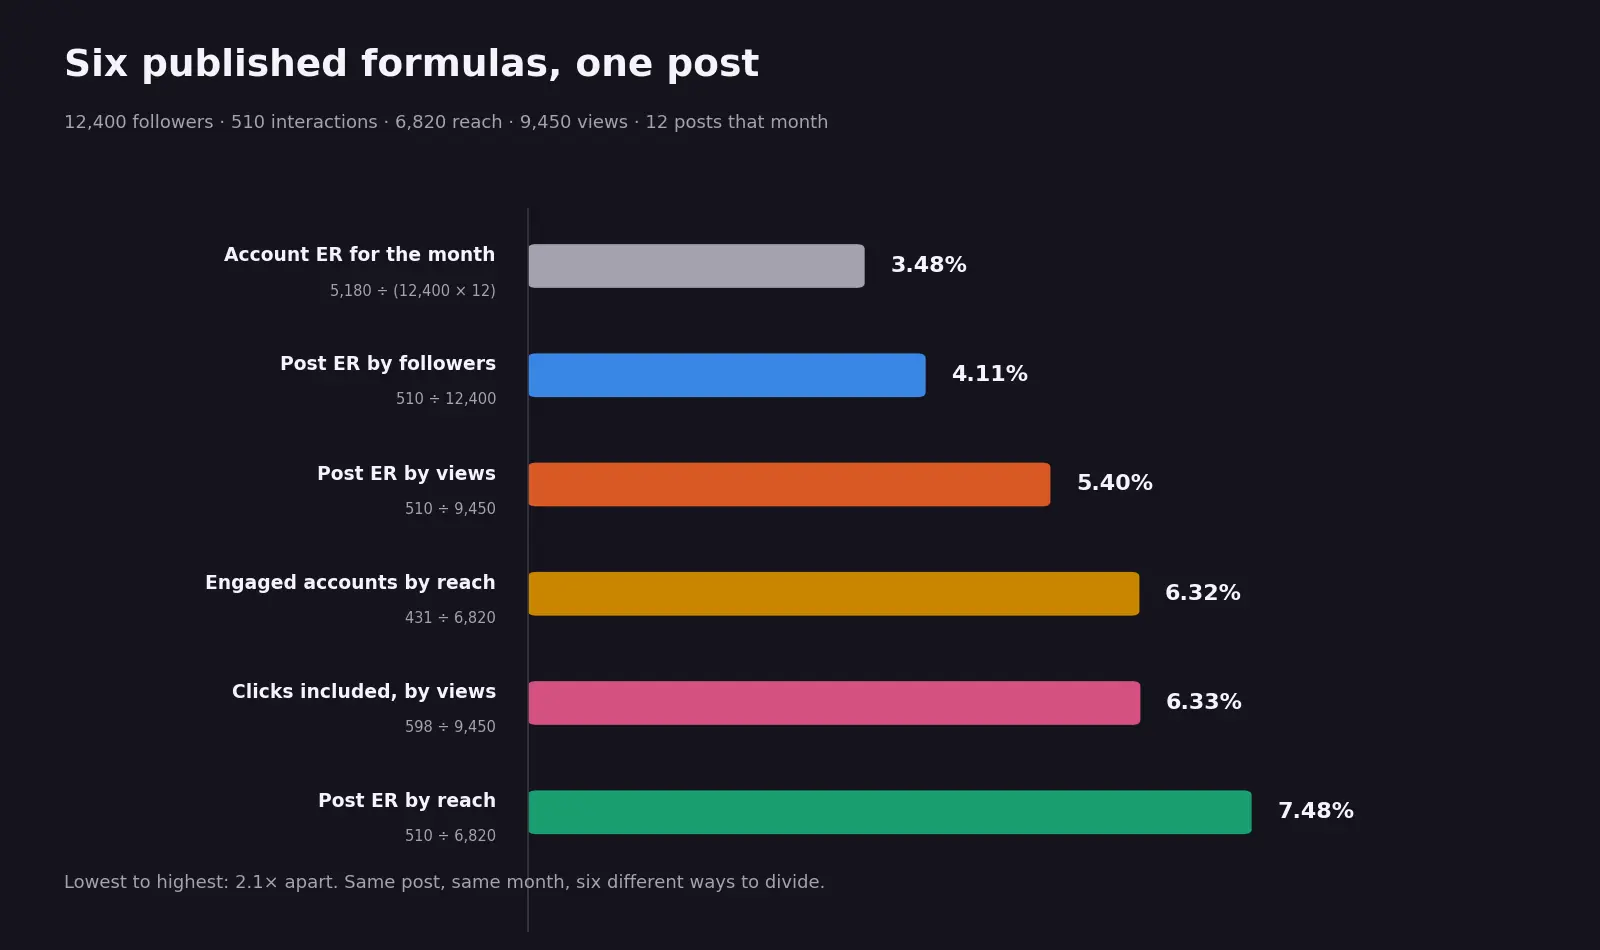
Engagement rate is interactions divided by audience size, times 100. The argument is over “audience”: followers, reach and views are each defensible, and each gives a different answer for the identical post. On the worked example below, one post produces six rates between 3.48% and 7.48% — same behaviour, 2.1× apart.
Here is that problem at industry scale. For Facebook, one 2026 benchmark study puts the median post engagement rate at 0.15% dividing by followers, while another puts it at about 5.6% dividing by reach — same platform, same period, roughly 37 times apart. Neither number is wrong. They answer different questions, and most people compare one against the other without noticing.
Method note. The follower-based figures below come from the Rival IQ 2026 Social Media Industry Benchmark Report — medians, 150 companies sampled per industry — and the Socialinsider 2026 benchmarks, which are averages across roughly 70 million posts. Both divide by follower count. The reach-based figures come from Buffer’s State of Social Media Engagement 2026, a median across 52 million posts. All three are 2026-branded reports analysing 2025 behaviour, which is normal for the genre and worth knowing before treating any of them as current. Platform behaviour is quoted from the platforms’ own developer and help documentation, checked on 2 August 2026.
One thing to fix before you calculate anything: several of the guides ranking for this query still tell you to divide by impressions. On Instagram, impressions was retired in April 2025. On Facebook the retirement began in November 2025 and finished in June 2026, taking the reach metric with it — both replaced by views and unique views. If you are working from a formula written before then, the field it asks for is no longer in your dashboard.
What the engagement rate formula actually asks you to choose
The formula has two moving parts, and only one of them gets discussed.
The numerator is total interactions on the post: likes, comments, shares and saves. This is mostly settled, with two exceptions covered further down — LinkedIn folds link and profile clicks into its own count, and X counts post expansions and profile-photo clicks as well.
The denominator is where the six answers come from. Three candidates, three different questions:
| Denominator | The question it answers | Use it when |
|---|---|---|
| Followers | Did the audience I built bother to show up? | Judging audience health, or vetting an influencer against a rate card |
| Reach (unique accounts that saw it) | Of the people who actually saw this, how many acted? | Judging the creative itself, independent of distribution |
| Views (every play, repeats counted) | How much interaction did each delivery earn? | Comparing video formats where rewatching is normal |
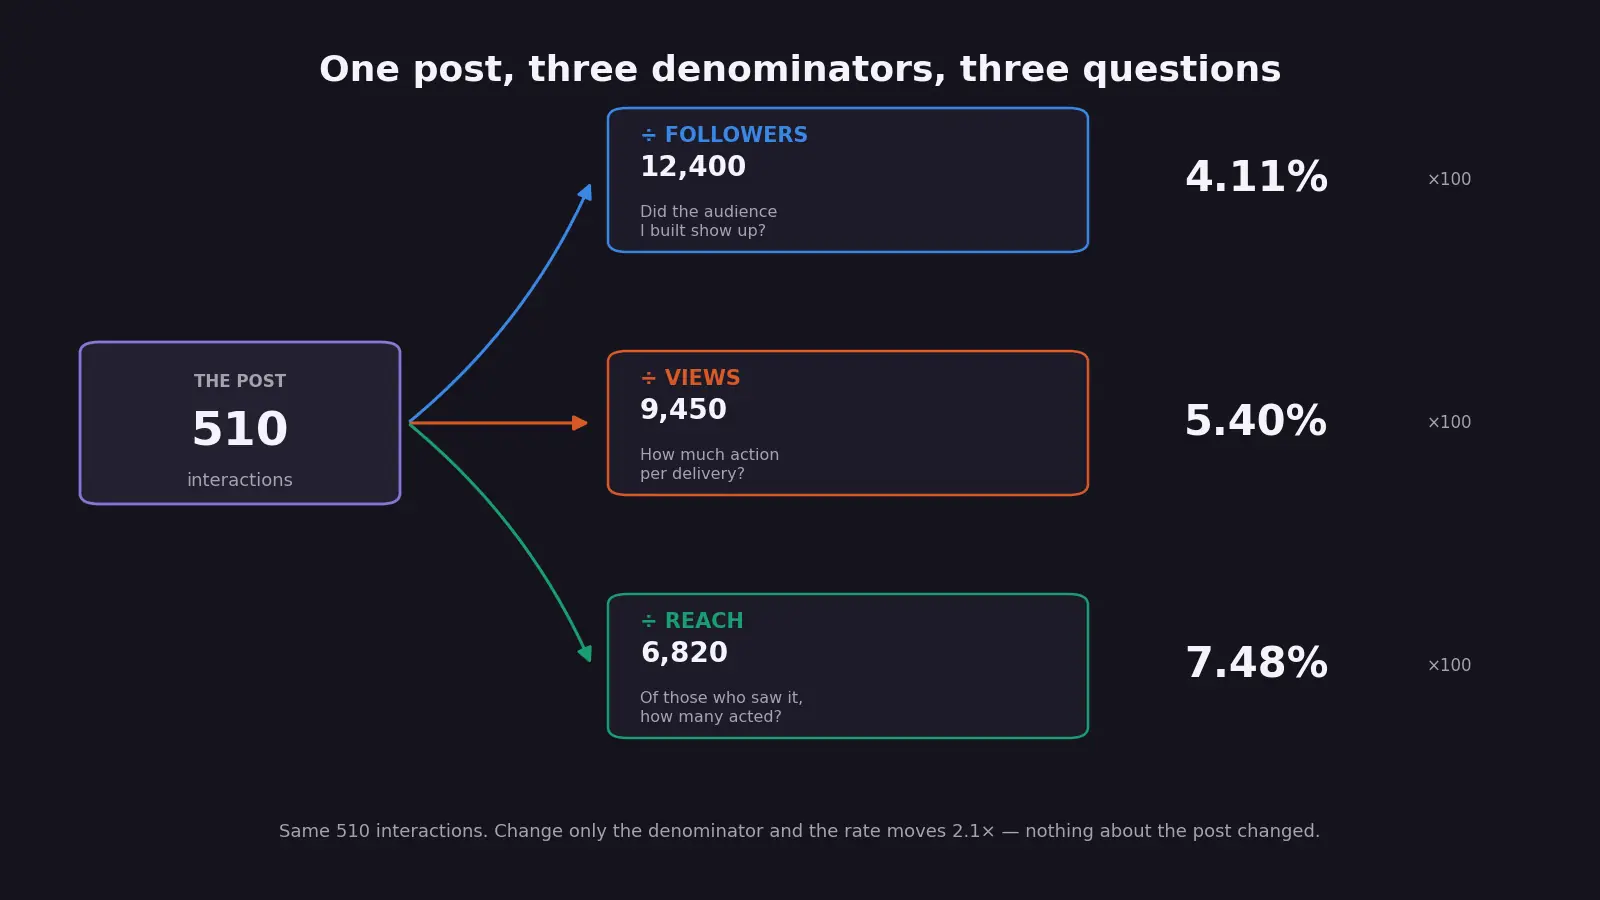
Views is always at least as large as reach, because views counts the same person twice. Neither has a fixed relationship to your follower count: a post that travels well can out-reach the audience you built, and a post that flops will not come close. That is why the rate moves so much — nothing about the post changed, only what you divided by.
One post, six engagement rate calculations, six different numbers
Worked example, illustrative figures chosen to be typical rather than flattering. An Instagram account with 12,400 followers publishes one post:
- Likes 386 · comments 24 · saves 61 · shares 39 → 510 interactions
- Reach 6,820 unique accounts · views 9,450 · accounts that engaged 431
- Link and profile clicks 88 · the account posted 12 times that month for 5,180 total interactions
| # | Method | Calculation | Result |
|---|---|---|---|
| 1 | Post ER by followers | 510 ÷ 12,400 × 100 | 4.11% |
| 2 | Post ER by reach | 510 ÷ 6,820 × 100 | 7.48% |
| 3 | Post ER by views | 510 ÷ 9,450 × 100 | 5.40% |
| 4 | Engaged accounts by reach | 431 ÷ 6,820 × 100 | 6.32% |
| 5 | Clicks-included by views | 598 ÷ 9,450 × 100 | 6.33% |
| 6 | Account ER for the month | 5,180 ÷ (12,400 × 12) × 100 | 3.48% |
Five of those six are formulas published by platforms or benchmark vendors; the sixth, method 5, shows what happens when you fold clicks into the numerator the way LinkedIn does. All six describe one post from one account in one month, and the lowest and highest differ by a factor of 2.1.
Three readings worth taking from the table. Method 4 is the honest one for “how many people engaged” — methods 1 to 3 count actions, so one person who likes, saves and shares counts three times. Method 6 sits below method 1 whenever the post you picked beat the month’s average, which is usually the post someone chose to report on: here it drew 510 interactions against a monthly average of 432. And method 5 shows how a definition change alone moves the number — adding clicks to the numerator lifted the same post by nearly a full point.
What each platform gives you as a denominator in 2026
The formula you can run is limited by what your analytics actually exports, and on two platforms that changed in the last eighteen months. This is the part no calculator page tells you.
| Platform | Denominators available natively | Shows an engagement rate itself? | Practical choice |
|---|---|---|---|
| Views (repeats counted), reach (unique accounts). Impressions removed April 2025 | No | Reach | |
| Views, unique views. Impressions retirement began November 2025 and finished June 2026, taking reach with it | No | Unique views | |
| TikTok | Video views, total viewers (unique) | No | Video views |
| Impressions, unique impressions | Yes — engagements ÷ impressions | Its own figure, or recompute without clicks | |
| YouTube | Views, unique viewers, impressions (thumbnails served) | No | Views |
| X | Impressions, engagements | Yes — engagements ÷ impressions | Its own figure, with a caveat |
Two traps hide in that table.
YouTube’s “impressions” is not the impressions everyone else means. It counts how many times your thumbnail was shown in a feed or sidebar, whether or not anyone watched. Dividing comments by thumbnail impressions produces a number that is real but not comparable to anything on any other platform.
Facebook lost reach in June 2026, not just impressions. Vendor changelogs count anywhere from eight to eighty-five affected fields depending on how finely they enumerate variants; the substance is that reach and unique-video-view metrics stopped receiving data and were replaced by unique views. If you keep a historical engagement rate series for a Facebook page, the denominator underneath it changed mid-year, and your trend line has a seam in it that has nothing to do with performance.
Why LinkedIn’s and X’s built-in engagement rates are not your engagement rate
Two platforms hand you a finished percentage, which is convenient and quietly incomparable to everything else you measure.
LinkedIn defines engagement as clicks, likes, comments and shares over impressions. It is one of two major platforms that put clicks in the numerator, and on a professional post clicks are usually the largest single interaction type. A LinkedIn engagement rate is therefore structurally higher than the same post’s rate under a likes-comments-shares definition.
X is the other, and it goes further. Its own documentation counts as engagement any click anywhere on the post — reposts, replies, follows, likes, link clicks, embedded media, the username, the profile photo, and expanding the post. Divided by impressions, that produces the broadest numerator of any platform.
The practical consequence: a dashboard row reading “LinkedIn 6.4%, Instagram 1.1%” is not a comparison. It is two different metrics printed in the same column. Either recompute LinkedIn without clicks, or label the column with the definition and stop reading across it.
What is a good engagement rate: benchmarks by platform
There is no single good number, because the published benchmarks themselves split on the denominator. Here are both, side by side, from the 2026 benchmark reports — all of which analyse 2025 behaviour.
| Platform | ER by follower | ER by reach* |
|---|---|---|
| TikTok | 2.0–2.6% | ~4.6% |
| 0.30–0.48% | ~5.5% | |
| ~0.15% | ~5.6% | |
| X | 0.03–0.12% | ~2.5%* |
| YouTube | ~0.21% | not reported |
| not covered | ~6.2%* |
* The reach column is Buffer’s, and Buffer substitutes impressions or views wherever a platform does not report reach — which is the case for LinkedIn and X. Those two rows are impressions-based and sit in a different unit from the rest of the column. Ranges appear where the two follower-based studies disagree; they sample different company sets, so treat the range as the honest answer rather than picking the flattering end. Facebook’s follower figure comes from one of those studies only, because the other publishes no traceable headline for it.
TikTok leads Instagram on followers by roughly five to eight times, and on reach the order reverses outright — Instagram at about 5.5% against TikTok’s 4.6%. The reason is distribution, not content: TikTok pushes far past the follower graph, so its follower-based rate flatters it and its reach-based rate does not.
By industry on Instagram, the 2026 benchmark report puts higher education and sports well above the median, with retail and beauty near the bottom. That gap is larger than most of the tactical differences people try to fix, which is the argument for benchmarking against your own past posts before benchmarking against a study.
The benchmark mismatch that makes your number look broken
This is the most common way the calculation goes wrong, and it happens after the arithmetic is correct.
You compute your Instagram rate by reach, because reach is what Insights hands you, and get 7.5%. You then find a benchmark saying the Instagram figure is 0.3% and conclude you are outperforming the industry by twenty-five times. You are not. That benchmark divides by followers. Against a like-for-like reach figure of roughly 5.5%, your 7.5% is good but ordinary.
The reverse error is worse, because it costs money. You compute your Instagram rate by followers, get 0.4%, compare it to the reach-based 5.5% in the same table, and conclude the channel is dead. Against the like-for-like follower figure of 0.30–0.48%, it is performing right at the middle.
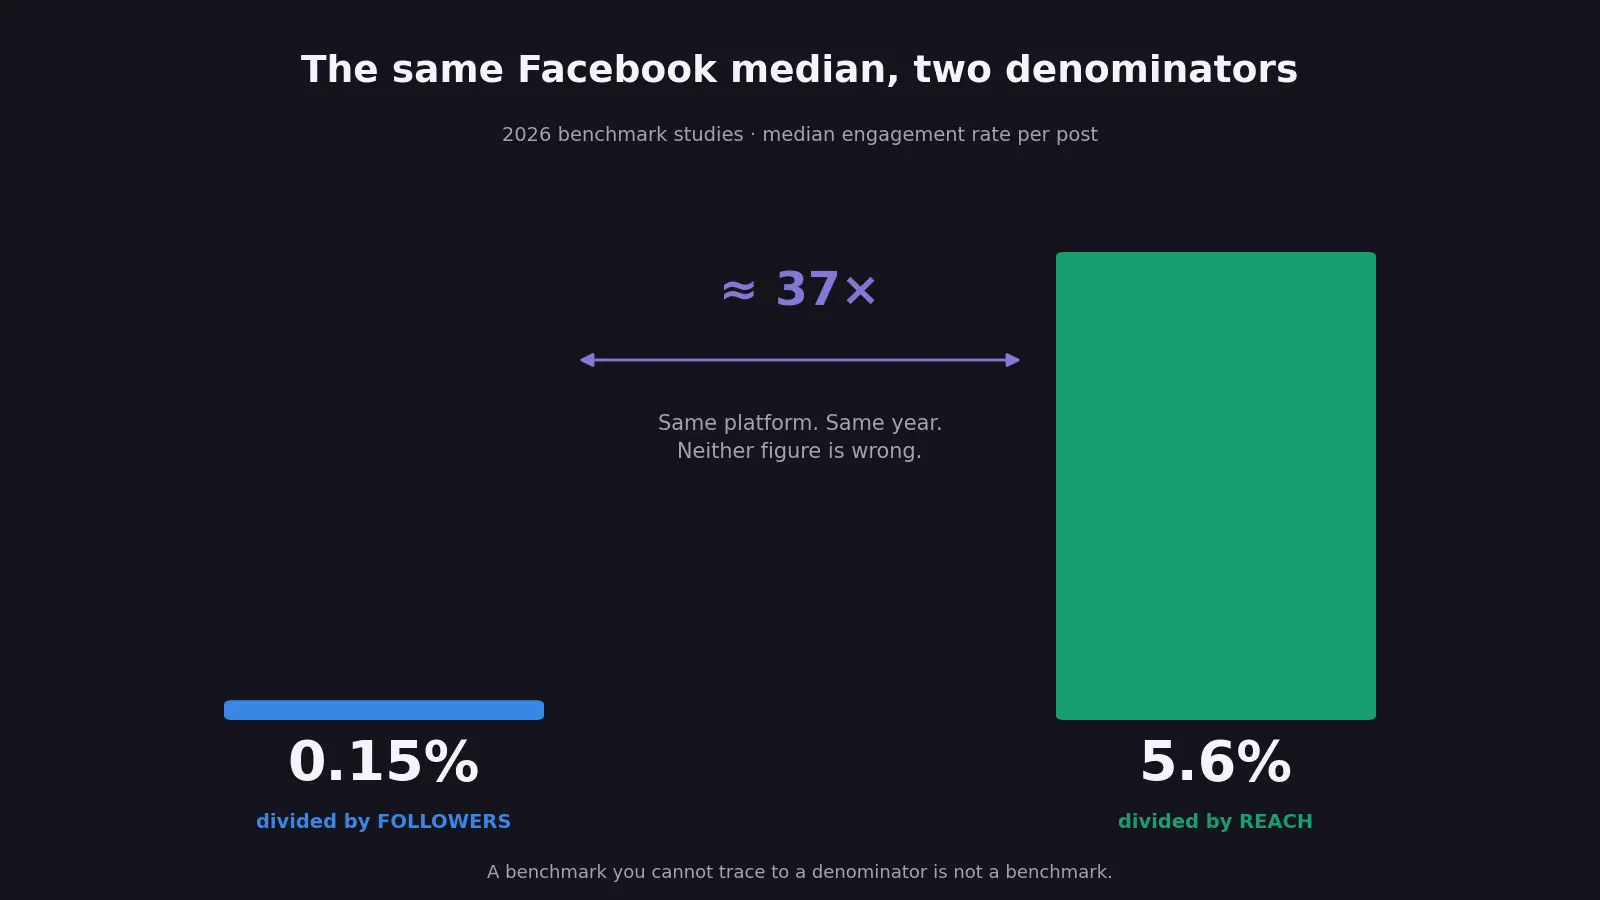
One rule prevents both: a benchmark is only usable if you know its denominator. If a source publishes a number without stating what it divided by, it is not a benchmark, it is a decoration. Rival IQ and Socialinsider state theirs outright; Buffer states reach as its default and discloses where it substitutes impressions or views. That disclosure is why all three are quoted here — and why the LinkedIn and X figures above carry an asterisk instead of being quietly averaged in.
How to pick your denominator and lock it
Pick by the decision the number has to support, not by which one is available.
- Judging creative — use reach. It isolates the post from distribution, so a strong post on a bad day still reads as strong. This is the default for content testing.
- Judging audience health — use followers. It is the only denominator that punishes you for an audience that stopped showing up, which is exactly the failure you want visible.
- Vetting influencers — use followers. Not because it is the better metric, but because it is the market convention: rate cards, influencer calculators and agency screens all run on follower-based rates, so a reach-based number cannot be compared to anything. If that vetting is the actual job, our influencer marketing team screens on follower-based rates for the same reason.
- Judging paid amplification — use the platform’s own impression-based figure. Paid delivery is measured in impressions on the buying side, and mixing denominators between the organic and paid halves of one campaign makes the comparison meaningless.
Then lock it, and write it down where the reporting lives. Two more rules make the series survive:
- Never mix denominators inside one chart. A trend line is only a trend if the divisor stayed constant.
- When a platform retires a metric, restate the history. Facebook’s reach-to-unique-views switch in June 2026 is the current example: leaving the old points untouched creates a step change that looks like a performance event and is not one.
What engagement rate on social media cannot tell you
Engagement rate is a ratio, and every ratio can be improved by damaging the denominator. Reach collapses, the rate climbs, and the report looks like a win. Always publish the rate next to its raw numbers — interactions and denominator, both absolute — so that failure mode is visible in the same glance.
Three more limits worth stating plainly:
- Small accounts win by construction. A few interactions divided by a small audience produce double-digit rates that a 500,000-follower account mathematically cannot reach. Comparing across account sizes without banding by follower count compares arithmetic, not performance.
- It does not measure money. Saves and shares correlate with intent better than likes do, but no engagement rate has ever been a revenue figure. It is a content-quality signal, and treating it as a business KPI is how teams end up optimising for reactions nobody buys from.
- Most of the medians are falling. Published rates dropped on most platforms through 2025 as feeds shifted toward recommended rather than followed content — though X moved the other way in the same studies. A flat rate year over year is, against that backdrop, usually an improvement.
Used properly it is one of the cleanest signals in social: cheap to compute, hard to fake, and immediately actionable at the post level. It just has to be the same formula every time. If the reporting is the part that keeps slipping, that is what our social media team sets up first — one denominator, one definition, written down before the first chart.
09 / Reader questions
Frequently asked questions
01What is the formula for engagement rate?
Engagement rate = (total interactions ÷ audience size) × 100. Interactions are likes, comments, shares and saves on a post. Audience size is the part that varies: followers, reach or views are all defensible choices, and each produces a different percentage for the identical post.
02What does a 1% engagement rate mean?
A 1% engagement rate means one interaction for every hundred units of your denominator — so it means very different things depending on which denominator was used. Measured against followers, 1% is well above the published figures for Instagram and Facebook. Measured against reach, 1% is well below them.
03Is 2.5% engagement good?
By follower count, 2.5% is strong on Instagram, Facebook, X and YouTube, and roughly at the middle of the reported range on TikTok, where published figures run 2.0–2.6%. By reach, 2.5% is below average, because reach-based figures sit near 5.5% on Instagram and Facebook. Check the denominator before judging.
04Is a 20% engagement rate good?
A 20% engagement rate almost always signals a small denominator rather than exceptional content. Accounts under a few thousand followers routinely post double-digit rates because a handful of interactions divides into a tiny audience. Treat any figure above roughly 10% as a prompt to check the sample size first.
05How do you calculate engagement rate on Instagram?
Add likes, comments, saves and shares for the post, divide by its reach, and multiply by 100. Instagram Insights gives you reach and views but no engagement rate of its own, and impressions was retired in April 2025 — so any older guide telling you to divide by impressions points at a field that no longer exists.
06What is a good engagement rate on Instagram?
Against followers, the cross-industry figures published in the 2026 benchmark reports land between roughly 0.3% and 0.5% per post, so anything above 1% is comfortably strong. Against reach, the comparable figure is around 5.5%. Higher education and sports accounts consistently sit at the top; retail and beauty at the bottom.