Published
Your Steam wishlist ranking is a position on a chart of unreleased games ordered by wishlist activity — an ordering, not a count. Valve has never published how it is computed. Developers have suspected since the chart appeared, and analysts with large private datasets now report, that it gives weight to recent additions rather than lifetime totals alone, which is why a rank can move hundreds of places in a week while the underlying number barely changes.
How this was checked. For this query in the United States on 10 August 2026, Google returns no AI Overview. The first page is five live charts — Steam’s own Top Wishlists filter, SteamDB, a third-party mirror, a Steam curator and a YouTube round-up — plus two Reddit threads and one paywalled newsletter post. Every chart tells you who is winning; none tells you what a position means. The figures below come from nine published sources dated between December 2018 and June 2026, and each carries its date and the pool it was measured against, because on this topic the pool is where most of the confusion lives.
What the Top Wishlists chart appears to rank, and what Valve has never said
Steam’s Top Wishlists filter shows unreleased titles in order. It does not display wishlist counts, and it does not state the period it covers. When Game Developer looked at the filter shortly after it appeared, in December 2018, the reporting was already hedged: developers “suspect that the list ranks recent wishlists for unreleased games rather than total wishlists received to-date,” and neither the time window nor the numbers were shown. Valve has not published a definition since.
More than seven years later the analysts working with the largest private datasets say the same thing. Alinea Analytics, publishing its own 2026 estimates in February 2026, notes that Steam’s official ranking “also emphasises recent ‘velocity’ (how quickly a game is gaining new wishlists) and other factors” — which is why its own list of the most-wishlisted 2026 titles does not match the order on Steam’s chart.
Neither is a statement from Valve, and no one outside Valve has confirmed the formula. Treat it as the best available reading rather than a specification. On that reading, three consequences follow:
- A rank is relative, so it moves when other games move. A title entering its announcement week can displace fifty games that did nothing wrong.
- Releases empty the pool from the top. The chart covers unreleased titles only. Every launch removes a game above you, and the largest games leave in clusters around seasonal release windows.
- The surrounding features are not stable either. Valve reported in June 2026 that Popular Upcoming was changing to a higher bar for entry. A threshold quoted from before that date describes a feature that has since moved, and any rank or placement compared across that boundary is not a like-for-like comparison.
The practical reading: a rank is a momentum signal, useful week over week for your own game, and close to meaningless as a measure of how many people want it.
What 25,000 wishlists means depends on which pool you are counted against
This is the most-repeated pair of numbers in the niche, and the pool attached to it is almost always dropped in the retelling.
GameDiscoverCo, in a post dated 20 September 2024, put it this way: above 25,000 wishlists you are in the top 4% of unreleased titles, and at roughly 100,000 you are in the top 1%.
Video Game Insights, in a study published 23 July 2025, reported that only 6% of projects released in the previous twelve months had passed 100,000 wishlists — 301 games, 22 of them above a million — while 66% had fewer than 10,000.
Both are correct and they are not comparable. One counts every unreleased store page in existence, a pool inflated by thousands of projects that are announced, half-built and quietly abandoned without ever reaching a release date. The other counts games that actually shipped, a smaller and heavily self-selected group. The same 100,000 wishlists is the top 1% of the first pool and roughly the top 6% of the second.
| Figure | Pool it is measured against | Source and date |
|---|---|---|
| >25,000 wishlists = top 4% | All unreleased Steam store pages | GameDiscoverCo, 20 Sep 2024 |
| ~100,000 wishlists = top 1% | All unreleased Steam store pages | GameDiscoverCo, 20 Sep 2024 |
| 6% passed 100,000 wishlists (301 games) | Steam games released in previous 12 months | Video Game Insights, 23 Jul 2025 |
| 66% below 10,000 wishlists | Steam games released in previous 12 months | Video Game Insights, 23 Jul 2025 |
| 9% sold more copies than wishlists at launch | 1,500-game subset of the same study | Video Game Insights, 23 Jul 2025 |
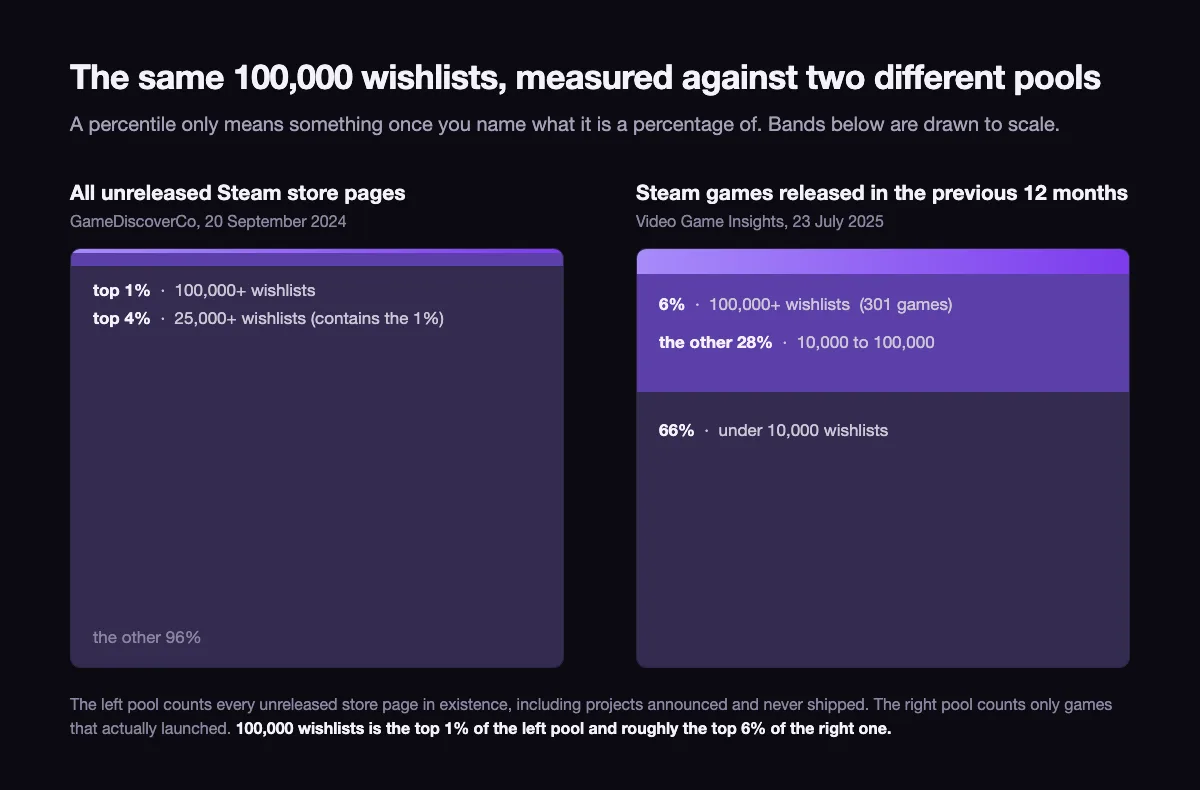
Two qualifiers, because this is where the topic breaks. First, the pools inside a single study are not always the same size: 301 games being 6% implies a released-game pool of roughly 5,000, while the sold-more-than-wishlists figure is drawn from a 1,500-game subset. Percentages from one study still need their own denominators read. Second, neither organisation publishes its raw list, and neither can see Valve’s internal figures for games whose developers have not disclosed them; both work from a mix of disclosures and modelled estimates. Treat the thresholds as well-sourced orders of magnitude. The 2024 percentages in particular are now nearly two years old, and the denominator has grown every year since.
The published wishlist numbers from 2018 to 2026, in one table
The numbers below are the reason developers come away confused. They appear to contradict each other, and in several cases they genuinely do.
| Published figure | What it actually measures | Sample and date |
|---|---|---|
| ~10% conversion | Pre-launch wishlists at launch, one studio’s own titles | Grey Alien Games, 7 Oct 2019 |
| 10% (2019), 7.3% (2020) | Wishlists to first-week sales, year cohorts | GameDiscoverCo, 15 Jun 2020 |
| 22% first week, 27% first month | Median conversion, 700 games with 5,000+ wishlists and 500+ first-month sales | GameDiscoverCo, 10 May 2024 |
| 10.5% median | First-week ratio, Aug–Oct 2024 releases with 5,000+ launch wishlists | GameDiscoverCo via Game World Observer, 6 Dec 2024 |
| Only 10% of releases beat 1.9% | First-week ratio, all new releases in the same three months | GameDiscoverCo via Game World Observer, 6 Dec 2024 |
| 5% day 1, 20% week 1, 60% year 1 | Median conversion by elapsed time | Impress Games calculator, undated |
| 0.15x median, 0.10x above $10 | First-week sales divided by wishlists, games with 25,000+ wishlists | GameDiscoverCo, 3 Nov 2025 |
| 15% under 5,000 rising to 25% at 100,000+ | Median first-week conversion by wishlist bucket | How To Market A Game benchmarks page, undated |
One pattern survives cleanly: conversion published for a longer window is always higher, because these studies fix the denominator at the wishlist count on launch day and then keep counting sales against it. A 60% year-one figure and a 5% day-one figure can describe the same game.
The second pattern people quote — that conversion rises with list size — does not survive contact with the other rows. One bucket table has it rising from 15% under 5,000 wishlists to 25% above 100,000. A different publisher reports 22% first-week median for games above 5,000 wishlists in 2024 and 15% for games above 25,000 in 2025, which points the other way.
Before reading either as a finding, look at what each sample excluded. The 22% cohort required 500 first-month sales as well as 5,000 wishlists, so games that launched to silence were filtered out of the numerator’s worst cases; the same publisher’s own figure for a comparable window without that filter is 10.5%. A survivorship rule that strict moves the median further than list size plausibly does. The honest position is that no published pair of studies isolates the effect of list size from cohort, year and sample rules, and anyone quoting a single “bigger lists convert better” law is quoting one table.
What you cannot do is average this table. The rows are not eight measurements of one quantity.
A ratio that reaches 2,929% was never a conversion rate
GameDiscoverCo’s most recent study, published 3 November 2025 and covering the year to September 2025, reports a median of 0.15x for games with 25,000 or more wishlists — roughly 15,000 first-week sales per 100,000 wishlists. In the same dataset the top performer reached 29.29x, with Mage Arena at 8.67x and R.E.P.O. at 7.51x.
A conversion rate cannot exceed 100%. You cannot convert more wishlists than you have. What is being measured is first-week sales divided by wishlists, and sales include everyone who bought without ever wishlisting — the streamer audience, the front-page browser, the friend who was told to buy it tonight. A 29.29x game did not convert its wishlists brilliantly; it sold overwhelmingly to people who were never on the list.
The distinction is not pedantic, because the two readings imply opposite decisions. Read as conversion, a low ratio says your store page or your price failed. Read correctly as a ratio, a low number can equally mean your wishlists were fine and no outside audience arrived. Video Game Insights’ finding that only 9% of a 1,500-game sample sold more copies than they had wishlists at launch sets the scale: exceeding 1.0x is rare, and everything above it is driven by discovery that happened after launch, not by the list.
Wishlists also explain less than half of what happens. The same study found a 70% correlation between wishlist count and first-month sales, which is about 49% of the variance — leaving 51% to price, genre, reviews, timing and everything else.
Wishlist age moves with launch outcome: 411 days against 214
The most quoted number in the recent data is not about how many wishlists you have. It is about how long you spent collecting them.
In GameDiscoverCo’s November 2025 study, games that underperformed at launch had kept their store page open for an average of 411 days before release. Games that performed well averaged 214 days. Nearly twice as long on the shelf, worse results.
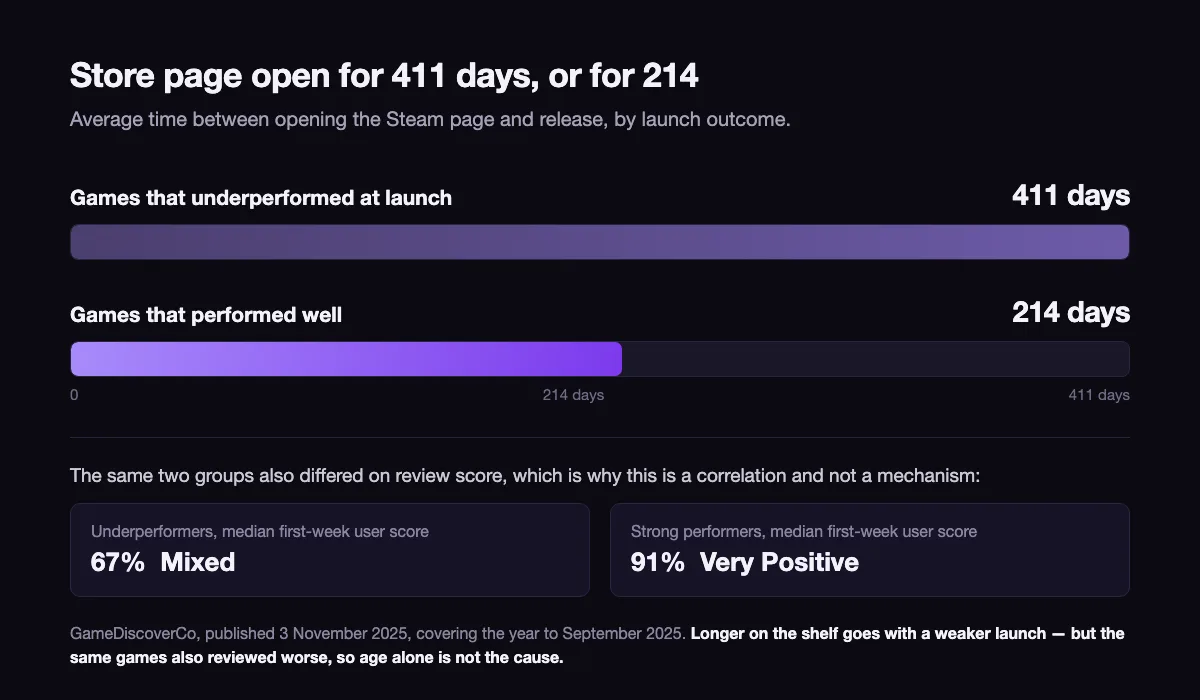
This is a correlation, and the same study supplies the obvious confounder. Those underperforming games had a median first-week user score of 67%, Mixed, against 91%, Very Positive, for the ones that did well. They were also, simply, worse-reviewed games. Long development and a weak reception plausibly share a cause, so 411-against-214 cannot be read as “shortening your run-up improves your launch”.
What the gap does support is a narrower claim about what a wishlist is worth. A wishlist is a promise made by someone who saw your game once, and interest decays; by the time a launch email lands a year later, a share of that list no longer recognises the title. One operator model, published by Crewforge in May 2026, estimates that a wishlist added in the last 30 days converts five to ten times better than one that has been sitting for eighteen months — a modelled figure, not a measured benchmark, and worth reading as a direction rather than a multiplier.
Video Game Insights found a matching pattern on the accumulation side: successful projects gathered more than 70% of their wishlists in the four months before launch, and most strong performers opened their store page six months to a year out. Kingdom Come: Deliverance 2 had 72% of its eventual launch total in the final three months.
Which reframes the headline number. Two games with 40,000 wishlists are not obviously in the same position if one collected them over five months and the other over three years. The first has a live audience; the second may have an archive.
How you get those wishlists in the first place — announcement timing, the Next Fest slot, press and streamer outreach, the launch calendar — is a separate discipline with its own arithmetic, and we will cover it separately. This article is about reading the number you already have.
Followers cannot stand in for wishlists, and the mechanics are why
Because Steam hides wishlist counts but publishes follower counts, follower numbers get used as a proxy. It does not work, and the reason is mechanical rather than statistical.
The old rule of thumb, attributed to Grey Alien Games’ Jake Birkett and circulating since at least 2019, was that wishlists run about five times followers. Crewforge, writing in May 2026, recommends a pre-launch band of 5:1 to 15:1, calling above 20:1 a sign of a list padded with low-intent users and below 3:1 a sign of a community built without enough casual reach. Note what that second figure is: a range of what one operator considers healthy, not a measurement of observed spread. Neither number is a published distribution, which is the first problem — there is no public dataset of paired follower and wishlist counts to derive a multiplier from, because one side of the pair is private.
The second problem is that the two buttons are pressed for different reasons and do different things:
| Wishlist | Follow | |
|---|---|---|
| What the player is signalling | Intent to buy, eventually | Interest in updates |
| What Steam does with it | Notifies at launch and on every sale | Surfaces your posts in their feed |
| Who controls the contact | Valve, automatically | You, only when you publish |
| Visible publicly | No | Yes |
| Feeds store visibility thresholds | Yes | No |
So followers are the wrong instrument for estimating list size. They are not necessarily a worse signal per head: Crewforge’s model puts follower conversion in launch week well above wishlist conversion, on the reasoning that following is the more deliberate act. That is one operator’s estimate rather than a measured benchmark. The defensible conclusion is narrower and more useful: followers measure a different thing in a smaller, more committed group, and no published multiplier converts one into the other reliably enough to plan against.
The two Steam tier systems that get quoted as one
Chris Zukowski’s wishlist benchmarks, on How To Market A Game and updated June 2026, are the most-cited tiers in the niche. They are also routinely flattened, because there are two separate ladders on that page for two separate Steam features, and the headline summary uses single numbers where the detail uses ranges.
| Tier | Personal Calendar | Popular Upcoming |
|---|---|---|
| Bronze | 5,000–32,000 | under 6,000 |
| Silver | 8,000–60,000 | 7,000–10,000 |
| Gold | 50,000–120,000 | 10,000–20,000 |
| Diamond | 90,000–360,000 | 300,000+ |
Read the columns, not the row labels. Gold on the Personal Calendar ladder starts at 50,000; gold on Popular Upcoming starts at 10,000. Anyone quoting “gold is 50,000 wishlists” without naming the feature has merged two different scales, and the widely-repeated headline summary — bronze 5,000, silver 8,000, gold 50,000, diamond 90,000 — is the lower bound of the Personal Calendar column only.
Note also what these tiers are: thresholds for placement, the visibility Steam gives you before you have any sales to earn it with. They are not grades for a launch. And the Popular Upcoming column is the one that moved — Valve reported in June 2026 that the feature was changing to a higher bar for entry, so the 7,000-to-10,000 figures describe a threshold that has since risen by an amount Valve has not published.
For scale against those ladders: 66% of games released in the twelve months to July 2025 had fewer than 10,000 wishlists, which puts the majority at or below the silver band on the Personal Calendar column.
What to report when someone asks for your wishlist number
If you are briefing an investor, a publisher or an agency, a single number invites the wrong question. Four numbers describe the position honestly:
- Total wishlists, with the date the store page opened. The pair matters; the total alone does not. 40,000 in five months and 40,000 in three years are different assets.
- Wishlists added in the last 30 and 60 days. The closest thing you have to what the chart appears to weight, and the part of the list least likely to have gone cold.
- Your rank, with the date and the note that Valve has not published what it weights. Useful as a trend line for your own title, not as a cross-game comparison — and not comparable across the June 2026 changes.
- The comparison pool you are quoting against. Top 1% of unreleased titles and top 6% of released games can be the same 100,000 wishlists. State which.
Then the honest caveat: wishlist count explained about 49% of the variance in first-month sales in Video Game Insights’ study. It is the best single pre-launch number available, and it is roughly half the story. If you want a view of where marketing spend fits around it, our work with studios sits on the gaming solutions page.
Where the numbers in this article come from
Percentile thresholds: GameDiscoverCo (20 September 2024) and Video Game Insights (23 July 2025). The 70% correlation, the 49% of variance, the 9%-of-1,500 figure and the accumulation timings: Video Game Insights, same study. Conversion figures: GameDiscoverCo (June 2020, May 2024, December 2024 via Game World Observer, November 2025), Grey Alien Games (October 2019), Impress Games’ public calculator (undated) and the How To Market A Game benchmarks page (undated). Tier tables and the June 2026 Popular Upcoming change: How To Market A Game, updated June 2026. Chart mechanics: Game Developer (December 2018) and Alinea Analytics (February 2026). Follower ratios: Jake Birkett of Grey Alien Games via a 2019 write-up, and Crewforge (May 2026), the latter a model rather than a benchmark.
The September 2024 GameDiscoverCo post is paywalled at source and is quoted here from its public excerpt; the November 2025 study is quoted from a public repost of its findings rather than the original. Where a figure is a model rather than a measurement, it is labelled as one in the text. None of these organisations can see Valve’s internal numbers for games whose developers have not disclosed them. That is the ceiling on precision for this entire topic, and any article that presents a single confident conversion rate has quietly ignored it.
10 / Reader questions
Frequently asked questions
01What is a Steam wishlist ranking?
A Steam wishlist ranking is your game's position on Steam's Top Wishlists chart, which lists unreleased titles in order of wishlist activity. Valve has never published how the order is computed. Developers have suspected since 2018 that it ranks recent wishlists rather than lifetime totals, and Alinea Analytics reported in February 2026 that the ranking also emphasises how quickly a game is gaining wishlists, alongside other factors.
02How many wishlists do you need to be in the top 1% on Steam?
Around 100,000 wishlists put a game in the top 1% of unreleased titles, and more than 25,000 put it in the top 4%, per GameDiscoverCo's analysis published 20 September 2024. Those percentages are measured against every unreleased store page, a pool that includes thousands of projects that never ship, so they are not the same as the top 1% of released games.
03What is a good Steam wishlist conversion rate?
There is no single figure, and published numbers span from under 2% to 60% because they measure different windows and different samples. The most recent large study, GameDiscoverCo in November 2025, reports a median first-week sales-to-wishlist ratio of 0.15x for games with 25,000+ wishlists — a ratio rather than a conversion rate, because sales include buyers who never wishlisted.
04How many wishlists should I have at launch?
Chris Zukowski's benchmarks, updated June 2026, are placement tiers rather than launch grades, and there are two separate ladders that get quoted as one. On the Personal Calendar ladder, bronze starts near 5,000 wishlists, silver 8,000, gold 50,000 and diamond 90,000. The Popular Upcoming ladder runs far lower, from under 6,000 to 300,000, and Valve reported in June 2026 that its entry bar was rising by an amount it has not published.
05Are Steam followers a good substitute for wishlists?
No, followers cannot be used to estimate your wishlist count. The two buttons are pressed for different reasons and do different things: Steam notifies wishlisters automatically at launch and during sales, while followers only see updates you publish yourself. No published multiplier between the two is stable enough to plan against.
06Does the Steam Top Wishlists chart show wishlist numbers?
No. Steam publishes the ordering only, never the underlying counts, and it does not state the time window the ranking covers. Every public wishlist figure for someone else's game is either a developer's own disclosure or a third-party estimate, which is why published numbers for the same title differ.
07Why did my Steam wishlist rank jump without new wishlists?
Because rank is relative and appears to be weighted toward recent activity. Your position moves when other games gain or lose momentum, when titles release and leave the unreleased pool, and when Valve changes how the chart is built. Valve reported changes to Popular Upcoming in June 2026, including a higher bar for entry.