Published
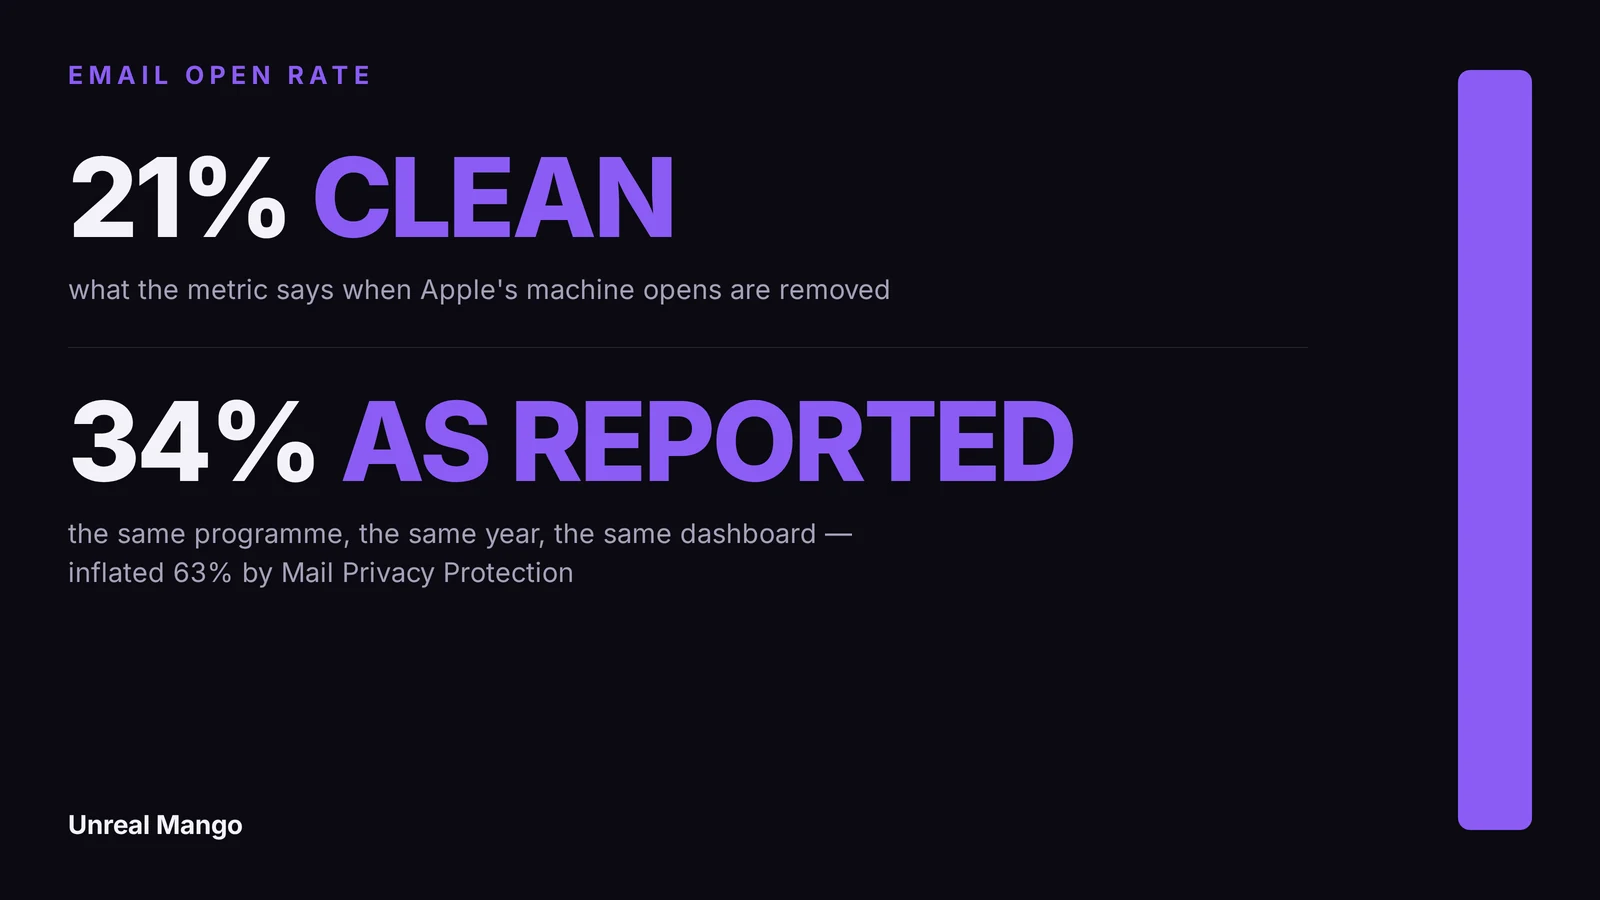
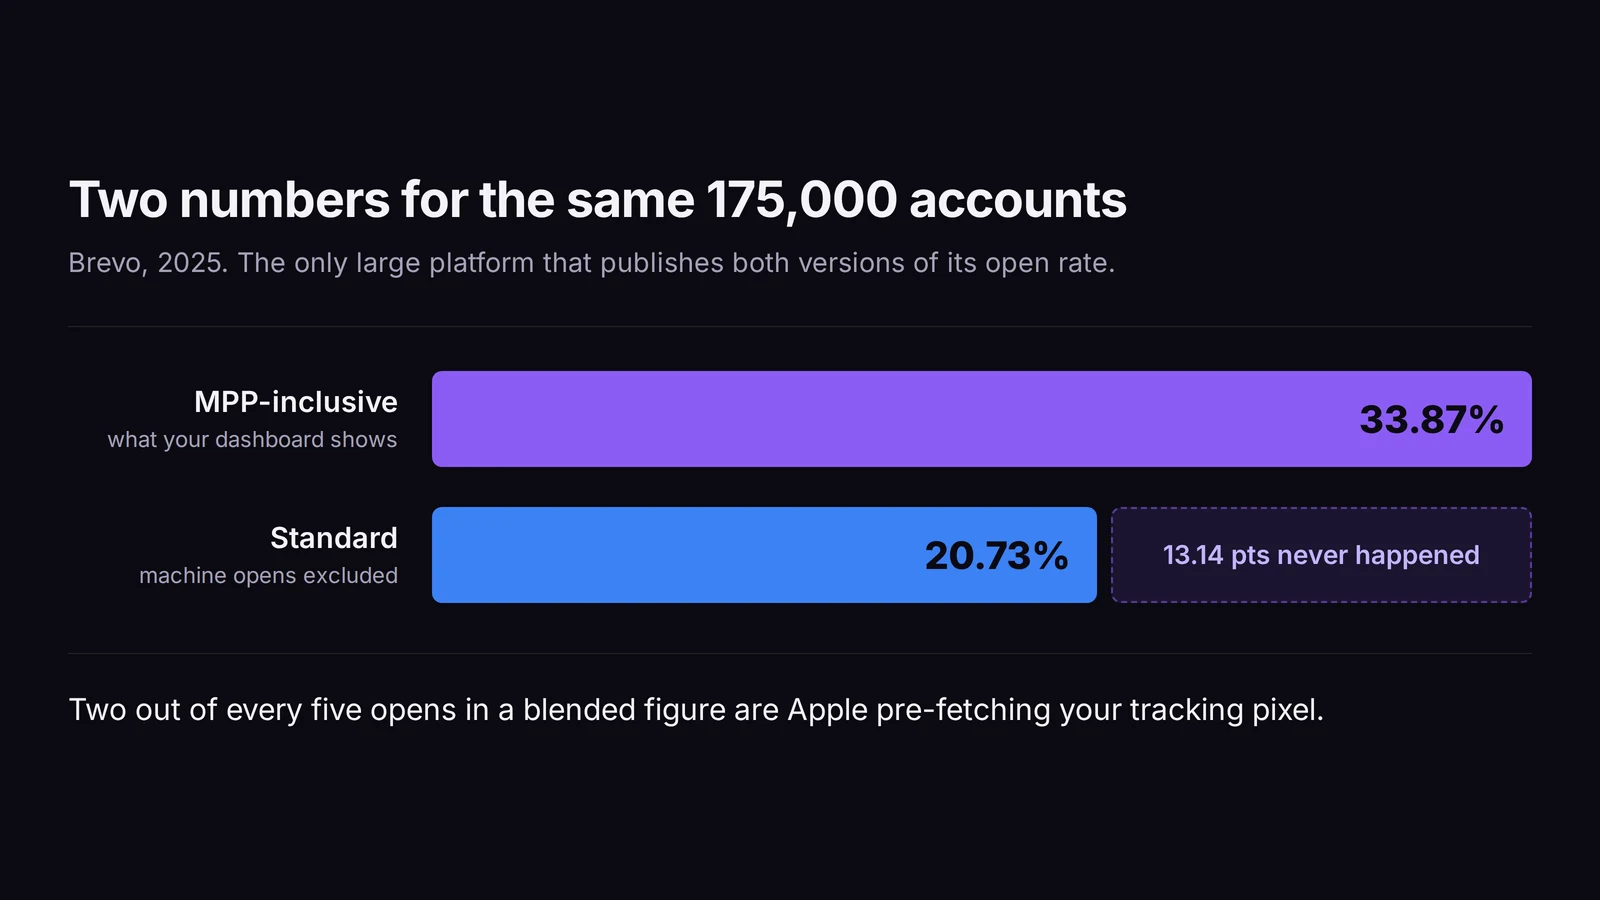
Across all industries a good email open rate is 20-25% when it is measured cleanly, and 33-43% as most dashboards report it. The gap is not performance. It is Apple Mail Privacy Protection opening messages on behalf of people who never did. Brevo’s 2025 data puts both numbers side by side: 20.73% standard, 33.87% MPP-inclusive. Individual industries sit well outside those bands in both directions, and the tables below say where.
How this was checked. In early August 2026 we pulled every organic result Google returned in the United States for “what is a good email open rate”, then read each ranking page for three things: the number it gives, the date of the data behind it, and whether it says anything about Apple’s machine opens. Benchmarks below come from the published datasets of Brevo (175,000+ accounts, 2025), MailerLite (3.6 million campaigns, December 2024 to November 2025), Mailchimp (updated December 2023) and Campaign Monitor (2021). Every figure carries its window, because on this topic the window is the whole story.
The pages ranking for this question disagree by nearly three times
Every result on page one answers the same question with a different number. Sorted from highest to lowest, the spread runs from 43.46% to 15%.
| Ranking page | The number it gives | Data behind it | Says MPP affects it? |
|---|---|---|---|
| MailerLite | 43.46% | 3.6M campaigns, Dec 2024 - Nov 2025 | Yes, explicitly |
| Klaviyo | 39.74% | window not stated | Mentions iOS 15 inflation |
| Mailchimp | 34.23% (35.63% all users) | as of December 2023 | Yes, disclaimer on the page |
| Constant Contact | 25-30% | window not stated | No |
| HubSpot Community | ~22.5% | forum answer, December 2023 | No |
| Campaign Monitor | 21.5% average, 17-28% range | 2021 | No mention anywhere |
| monday.com | 15-25% | article dated January 2026 | No |
Sort that table by the number and you have almost sorted it by two other things at once: how recent the data is, and whether the source counts Apple’s machine opens. The top of the list is large, recent, MPP-inclusive platform data. The bottom is older or unstated.
The cleanest way to see it is to put the two ends together. Campaign Monitor’s 21.5% covers calendar 2021, which is mostly before Mail Privacy Protection shipped in September of that year. Brevo’s MPP-excluded rate for 2025 is 20.73%. Four years apart, two platforms, two customer bases and two slightly different definitions of a clean open, so treat this as an order-of-magnitude check rather than a measurement.
What it shows is that there is no sign of an underlying engagement jump anywhere near large enough to explain the headline move. Other things did change over the same window — the Google and Yahoo bulk sender requirements of February 2024 lifted inbox placement across the board, and platforms got better at filtering bot opens — and both of those push a 2025 figure down rather than up. The reported number went up mostly because the measurement broke.
What Apple Mail Privacy Protection does to the number
Mail Privacy Protection shipped with iOS 15 in September 2021 and appears as an opt-in prompt the first time someone opens Mail on iOS or iPadOS 15 and later, or macOS Monterey and later. When it is on, Apple routes the message through its own proxy and pre-fetches the remote content inside it, including the invisible tracking pixel that every email platform uses to record an open.
The pixel fires. Your platform records an open. Nobody read anything.
Three consequences follow, and only the first one gets discussed:
- The open count is inflated. Litmus put Apple clients at 64.66% of all email opens in May 2026, on more than a billion opens, and estimates MPP affects 55-60% of opens outright. That is a share of opens rather than of subscribers, and MPP inflates it — but it rules this out as an edge case for most lists.
- The open time is fiction. The fetch happens when Apple decides, not when the person reads. Any send-time optimisation built on open timestamps is optimising against a machine’s schedule.
- Location and device data are gone. The request comes from Apple’s proxy, so the geography and hardware in your reports describe the proxy, not the subscriber.
The measured size of the gap
Brevo is one of very few large platforms that publishes both versions of the same metric for the same dataset: 20.73% standard against 33.87% MPP-inclusive across 175,000+ accounts in 2025. That is 13.14 percentage points, a 63% relative inflation, and it means roughly two out of every five opens in a blended dashboard figure never happened.
Your own multiplier depends entirely on how much of your list reads mail on Apple devices. beehiiv cites a newsletter that usually sat at a 28% open rate jumping to 55% after the rollout — illustrative rather than audited, but the right order of magnitude for an Apple-heavy consumer list. A B2B list on corporate Outlook will see far less. That variance is the reason no universal correction factor exists, and why the fix below is a segment, not a coefficient.
Email open rate benchmarks by industry
These are MailerLite’s published median open rates for December 2024 to November 2025, which are MPP-inclusive and therefore directly comparable to what your dashboard shows you. Industries below are a selection from a longer published list, chosen for relevance. The second column is our own derived estimate of the same figure with machine opens taken out, calculated by dividing by Brevo’s measured 1.63 ratio.
| Industry | Reported open rate (MPP-inclusive) | Derived clean estimate |
|---|---|---|
| Religion | 55.71% | ~34% |
| Non-profit | 52.38% | ~32% |
| Government | 48.52% | ~30% |
| Health and fitness | 47.81% | ~29% |
| Consulting | 45.96% | ~28% |
| Higher education | 43.98% | ~27% |
| Medical, dental and healthcare | 43.75% | ~27% |
| Business and finance | 43.34% | ~27% |
| Architecture and construction | 40.55% | ~25% |
| Agency | 40.52% | ~25% |
| Real estate | 40.37% | ~25% |
| Software and web app | 39.31% | ~24% |
| Home and garden | 39.18% | ~24% |
| Beauty and personal care | 38.40% | ~24% |
| Retail | 37.47% | ~23% |
| Manufacturing | 37.36% | ~23% |
| Marketing and advertising | 37.23% | ~23% |
| Computers and electronics | 35.29% | ~22% |
| E-commerce | 32.67% | ~20% |
| Travel and transportation | 30.10% | ~18% |
Read the second column as a size-of-gap indicator, not a target. It applies one platform’s blended ratio to another platform’s medians, and Apple share varies by audience. Brevo’s own MPP-excluded figures come in lower still for consumer categories — 16.67% for retail and 15.50% for e-commerce — which is what a different customer base should look like. If you need a real clean number for your own list, compute it rather than borrow it.
What the column is good for is settling arguments. A client comparing a 24% dashboard open rate against a published 40% benchmark is not underperforming by sixteen points. They are comparing a number that excludes machine opens against one that includes them.
Email click-through rate benchmarks by industry
Click rate is clicks divided by delivered emails. A machine that pre-fetches images does not click a link, so this number survives MPP intact. It is the benchmark to actually manage against. These are MailerLite’s published median click rates for the same December 2024 to November 2025 window, compared against an all-industry midpoint of roughly 2.3%.
| Industry | Click rate | Click rate vs. all-industry average |
|---|---|---|
| Manufacturing | 4.22% | well above |
| Government | 3.05% | above |
| Non-profit | 2.90% | above |
| Consulting | 2.41% | above |
| Business and finance | 2.37% | above |
| Medical, dental and healthcare | 2.25% | at average |
| Higher education | 2.15% | at average |
| Agency | 1.85% | below |
| Home and garden | 1.75% | below |
| Real estate | 1.72% | below |
| Architecture and construction | 1.68% | below |
| Travel and transportation | 1.68% | below |
| Health and fitness | 1.45% | below |
| Computers and electronics | 1.37% | below |
| Marketing and advertising | 1.30% | below |
| Retail | 1.27% | below |
| Software and web app | 1.15% | below |
| E-commerce | 1.07% | below |
| Beauty and personal care | 0.95% | well below |
Three independent all-industry averages for click rate: 2.3% in 2021 from Campaign Monitor, 2.62% in December 2023 from Mailchimp, 2.27% across 2025 from Brevo. The metric MPP cannot touch has barely moved in four years — which is the strongest available evidence that the open-rate jump over the same period was measurement, not behaviour.
One comparison that is not like for like: broadcast campaigns against automated flows. Brevo’s 2025 figures put automation emails at a 30.63% MPP-excluded open rate against 20.73% for campaigns, and a 7.39% click-through rate against 2.27%. That is more than three times the clicks, and it is real, because the recipient asked for the message by doing something. Judge a welcome flow against automation benchmarks, never against your newsletter.
Click-to-open rate is not the safe replacement everyone recommends
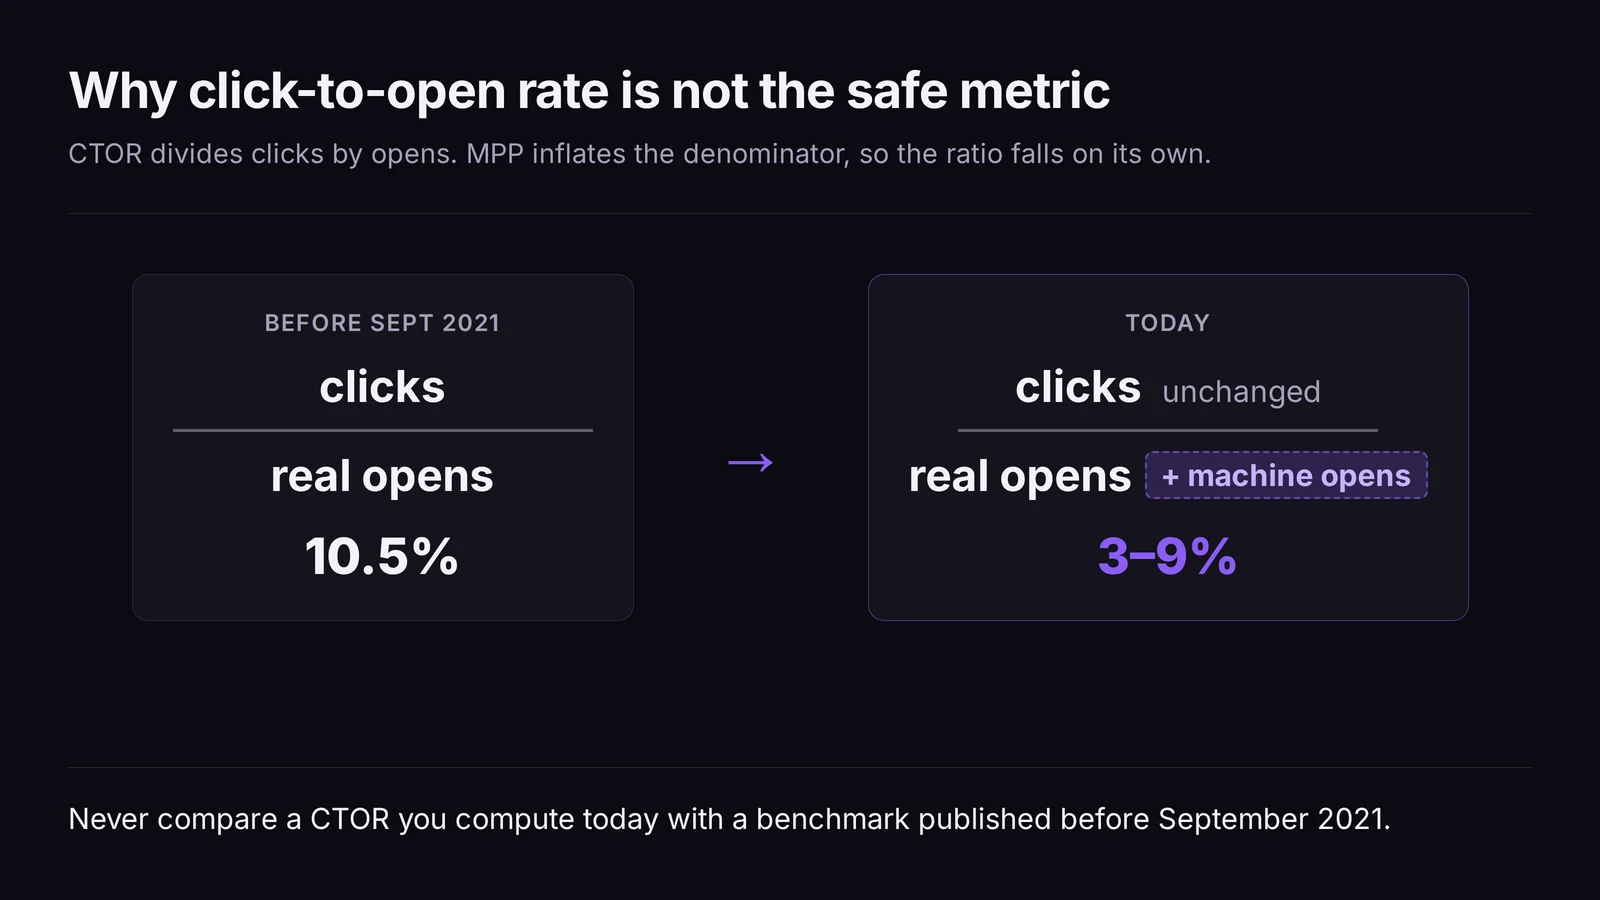
The most repeated advice on this search result is some version of “stop watching open rate, watch click-to-open rate instead.” It is wrong for a mechanical reason: CTOR is clicks divided by opens, and opens are the broken number. Inflate the denominator and the ratio falls.
MailerLite says as much on its own benchmark page: because the recorded opens are inflated, your true click-to-open rate is higher than the figure in your dashboard. The published medians reflect that. Campaign Monitor’s pre-MPP average for 2021 was 10.5%, in a 6-17% range. MailerLite’s 2025 medians land at 4.01% for e-commerce, 3.91% for beauty, 4.51% for retail and 5.40% for software, with non-profit and government near 8% and manufacturing an outlier at 14.82%. The direction is down for most industries, but the spread is wide enough that no single post-MPP CTOR benchmark is worth much. (These are separately computed medians, so they will not equal the click rate divided by the open rate in the tables above.)
| Metric | 2021, pre-MPP | 2025, MPP-inclusive | Direction |
|---|---|---|---|
| Open rate, all industries | 21.5% | 33.87% | inflated by the denominator problem |
| Click rate, all industries | 2.3% | 2.27% | unaffected |
| Click-to-open rate | 10.5% | 3-9% for most industries | deflated by the same problem |
So two rules follow. Do not compare a click-to-open rate you compute in 2026 against any benchmark published before September 2021 — they are different measurements wearing the same name. And do not treat CTOR as MPP-proof: it is only meaningful if you compute it on a segment where the opens are real.
How to clean MPP out of your open rate in four steps
There is no correction factor that works across lists, because Apple share is a property of your audience. What works is measuring a population where the pixel still means something.
- Find your Apple share. Break opens down by mail client or user agent in your platform’s reporting. Several platforms now flag Apple’s proxy opens directly; if yours does not, the combined Apple Mail and iOS Mail client share is a workable upper bound for the contaminated portion.
- Compute the open rate on the non-Apple segment only. Opens from non-Apple clients divided by emails delivered to non-Apple recipients. That single figure is your index. Never average the two populations into one number, because the blended result moves whenever your Apple share moves, even if nothing about your email changed.
- Check the timing signature. MPP fetches typically land within minutes of delivery and at hours nobody is awake. If your open curve has a spike at send plus zero to five minutes with no matching spike in the click curve, that is machines. A clean segment’s opens spread out across the day. On corporate lists, check the reverse too: a click spike inside those same first minutes, hitting every link in the email, is a security scanner rather than a reader.
- Rebase your history before you trend anything. Recompute the last twelve months on the clean segment. Any number in your own reporting from before September 2021 sits on a different measurement basis, and a chart that runs straight through that date is drawing a step change as if it were growth.
What you do not get back: the open timestamp, the location and the device. If your send-time optimisation is trained on open times, it is training on Apple’s fetch schedule. Move it to click times or to a fixed schedule you test properly.
The rule: opens up, clicks flat means you are looking at noise
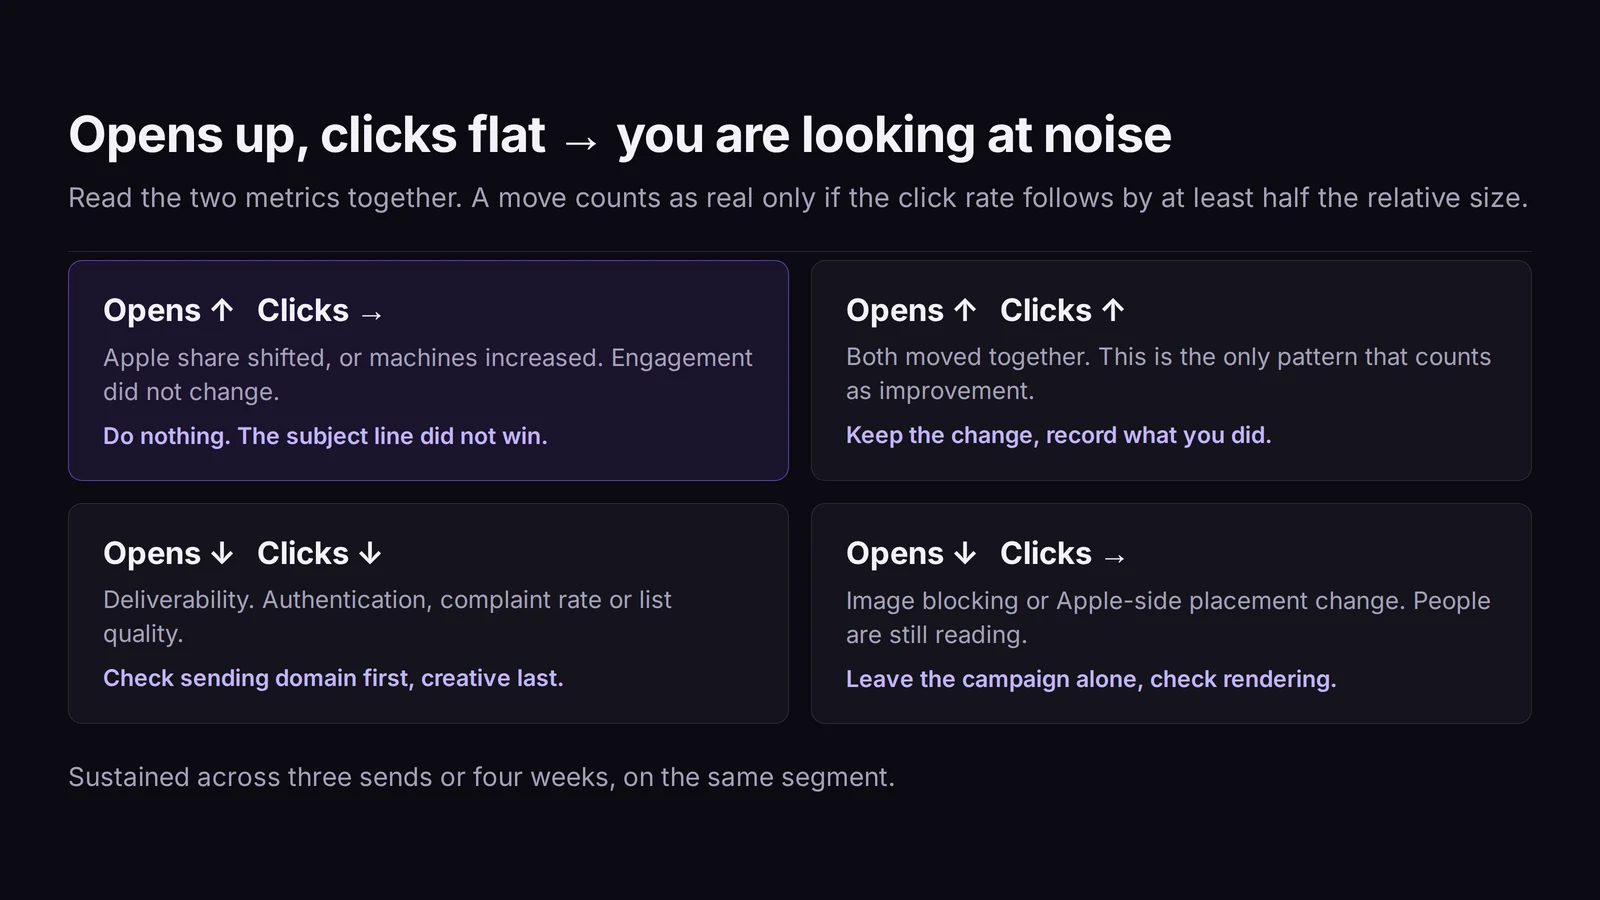
One check disposes of most open-rate panics and most open-rate victory laps. Compare the direction of the open rate with the direction of the click rate over the same window and the same segment.
| What moved | What it means | What to do |
|---|---|---|
| Opens up, clicks flat | Apple share shifted or machines increased. Engagement did not change. | Nothing. Do not roll out the “winning” subject line style. |
| Opens up, clicks up by at least half as much in relative terms | Real improvement | Keep the change and note what you did |
| Opens down, clicks down together | Deliverability. Authentication, complaints or list quality. | Check complaint rate and sending domain first, creative last |
| Opens down, clicks flat | Image blocking or Apple-side placement change. People are still reading. | Leave the campaign alone, investigate rendering |
The threshold that keeps this honest: treat an open-rate move as real only if the click rate moves the same way by at least half the relative size, sustained across three sends or four weeks on the same segment. A 30% jump in opens with the click rate flat inside plus or minus 5% is a measurement event, not a marketing one.
This is also the fastest way to catch a subject-line test that “won.” If the winning variant lifted opens and left clicks untouched, it did not win. It attracted the same clicks from a differently counted denominator.
Which email marketing KPIs survive MPP
Rebuild the reporting around what is still measurable. Everything below is calculated on delivered emails unless stated otherwise.
| KPI | Formula | Survives MPP | What it actually tells you |
|---|---|---|---|
| Delivery rate | delivered ÷ sent | Yes | Infrastructure and list hygiene |
| Open rate | opens ÷ delivered | No — inflated ~63% blended | Direction only, and only on a clean segment |
| Click rate | clicks ÷ delivered | Yes for MPP | The honest engagement number — but corporate link scanners click every link, so filter machine clicks on B2B lists |
| Click-to-open rate | clicks ÷ opens | No — deflated by the same inflation | Creative quality, if the denominator is clean |
| Conversion rate | conversions ÷ delivered | Yes | Whether the offer matched the audience |
| Revenue per recipient | revenue ÷ delivered | Yes | The only line a finance director will read |
| Unsubscribe rate | unsubscribes ÷ delivered | Yes | Frequency and relevance, early warning |
| Spam complaint rate | complaints ÷ delivered | Yes | Sender reputation; the bulk-sender ceiling is 0.3% |
| Reply rate | replies ÷ delivered | Yes | The strongest signal on B2B and cold lists |
| List growth net of churn | (new − lost) ÷ list size | Yes | Whether the programme has a future |
If you report to a client or a board, the top line should be revenue per recipient or conversions, with click rate as the diagnostic underneath it. Open rate belongs in the appendix with a footnote about how it was measured. A dashboard that leads with an inflated number trains everyone who reads it to manage the wrong thing.
What to do when the clean open rate really is low
Sometimes the number is bad for ordinary reasons. Once you are looking at a clean segment and the rate still sits well under twenty percent, the causes fall into a short list, in the order worth checking:
- Inbox placement, not persuasion. If a large share of a list stops opening at once, the message is landing somewhere other than the inbox. Authentication records and complaint rate come before subject lines.
- List age. A list that has not been cleaned in a year carries addresses that were valid and are now abandoned. Suppress anyone with no open and no click across the last six months and the rate on the remainder tells you something true.
- Frequency mismatch. Unsubscribe rate climbing while open rate falls is a cadence problem, and no amount of subject-line work fixes it.
- Wrong denominator entirely. A monthly newsletter to a purchased list and a triggered flow to recent buyers should never appear on the same chart.
The pattern worth naming: almost every low open rate that survives this checklist turns out to be an acquisition problem rather than an email problem. People who signed up for a discount code do not read a newsletter about your industry, and no subject line changes that. If the diagnosis lands on list quality or programme structure rather than copy, that is the point at which email marketing becomes a build rather than a fix.
10 / Reader questions
Frequently asked questions
01What is a good email open rate in 2026?
Across all industries, around 20-25% if your reporting excludes Apple's machine opens and 33-43% if it includes them, and the two are not comparable. Brevo's 2025 dataset of 175,000+ accounts reports both side by side: 20.73% standard and 33.87% MPP-inclusive. Individual industries run well outside those bands in both directions, so check the benchmark tables before judging your own number.
02Is a 50% open rate good for email?
It is above every published median, which is exactly why it deserves a check rather than a celebration. A 50% blended open rate on a list with a large Apple Mail share can sit on top of a clean rate near 30%. Confirm it by looking at the click rate: if clicks did not move with the opens, the extra opens are machines.
03What is a good email open rate for nonprofits?
Around 52% as your dashboard reports it: MailerLite's 2025 medians put non-profit at a 52.38% open rate with a 2.90% click rate, second only to religion at 55.71%. Those are MPP-inclusive figures. Applying Brevo's 1.63 ratio puts the clean equivalent near 32%, but that is a rough size-of-gap estimate rather than a target — compute it on your own non-Apple segment and manage the click rate instead.
04What type of email has the highest open rate?
Triggered and transactional messages, by a wide margin, because the recipient is expecting them. Brevo's 2025 data puts automation emails at a 30.63% open rate on the MPP-excluded basis against 20.73% for broadcast campaigns on the same basis, with a 7.39% click-through rate against 2.27%. The gap on clicks is more than three times, and clicks are the part MPP cannot inflate.
05What is a good email click-through rate?
Between 2% and 3% of delivered emails for a broadcast campaign, and it is the most reliable benchmark on this page because MPP cannot touch it. Campaign Monitor measured 2.3% in 2021, Mailchimp 2.62% in 2023 and Brevo 2.27% across 2025. Under 1% is worth investigating as a targeting problem rather than a creative one, unless your category already sits there — beauty and personal care runs at 0.95%.
06What is a good click-to-open rate?
Between roughly 3% and 9% on today's MPP-inflated opens, against 6-17% before September 2021, and the two are not comparable. CTOR divides clicks by opens, so inflating the denominator pushes the ratio down on its own. Campaign Monitor's 2021 average was 10.5%; MailerLite's 2025 medians sit mostly at 3-9%, with manufacturing an outlier at 14.82%.
07What is the 30/30/50 rule for cold emails?
It is a copy-structure heuristic, not a benchmark: roughly 30% personalisation, 30% value proposition and 50% focus on the call to action. The numbers add up to 110%, which tells you how literally to take them. It says nothing about what open rate to expect, and on cold lists the open rate is the least trustworthy number you have.