
Published
A marketing qualified lead (MQL) has shown interest your marketing can measure. A sales qualified lead (SQL) has shown a problem, a budget and a date a salesperson has verified. The gap between them is one conversation, and across 30 industries only 10% to 26% of MQLs survive it.
How this was checked. For this query in the United States on 8 August 2026, Google returned an AI Overview, a People Also Ask block, a short-video pack and an organic page dominated by Adobe, Salesforce, HubSpot, AdRoll, Klipfolio, Crunchbase and Kixie. Every one of them defines the two terms. Not one publishes the conversion band, the arithmetic that shows when an MQL count is misleading, or what to do when the two teams count differently. The benchmarks below come from three published First Page Sage research reports, each named with its definitions and dates so you can see why two of them disagree. One note before anything else: SQL here means sales qualified lead. Structured Query Language is an unrelated term that happens to share the letters, and nothing on this page is about databases.
The one word that separates a marketing qualified lead from a sales qualified lead
The word is verified.
An MQL is an inference. Marketing looks at what someone did and who they appear to be, applies a rule, and concludes that this person probably resembles a buyer. Nobody has spoken to them. The evidence is a form fill, a page sequence, a job title pulled from an enrichment tool and a score that crossed a threshold.
An SQL is a confirmation. A human has now talked to that person and established three things that a score cannot establish: there is a problem worth solving, there is money that could pay for it, and there is a reason to act inside a period you can name.
That is the entire difference, and it explains why the two teams argue. Marketing is measured on a prediction; sales is measured on what happens when the prediction meets a phone call. A conversion rate between them is really the accuracy score of marketing’s rule.
| Marketing qualified lead | Sales qualified lead | |
|---|---|---|
| Who decides | Marketing, usually via a scoring rule | A salesperson, in a conversation |
| Evidence | Behaviour and profile data | Stated problem, budget and timeline |
| Owner of the record | Marketing | Sales |
| Typical trigger | Threshold crossed, demo form, repeat visit | Discovery call completed and accepted |
| Failure mode | Rule too loose, volume looks good | Rule too tight, pipeline starves |
| What it predicts | That a conversation is worth having | That an opportunity is worth forecasting |
MQL to SQL conversion rate benchmarks across 30 industries
First Page Sage analysed its agency client data gathered between 2019 and 2025 and published MQL to SQL conversion rates for 30 industries; the report is bylined October 2024 and was last modified in December 2025. Its definitions matter and are quoted precisely below the table, because they set the numbers.
| Industry | MQL to SQL |
|---|---|
| Business Insurance | 26% |
| HVAC | 26% |
| eCommerce | 23% |
| Heavy Equipment | 23% |
| Hotels & Resorts | 22% |
| Higher Education | 21% |
| Pharmaceutical | 21% |
| Transportation & Logistics | 19% |
| Automotive | 18% |
| Environmental Services | 18% |
| Industrial IoT | 18% |
| Aerospace & Aviation | 17% |
| Entertainment | 16% |
| Manufacturing | 16% |
| Biotech | 15% |
| Cybersecurity | 15% |
| Addiction Treatment | 14% |
| Software Development | 14% |
| B2B SaaS | 13% |
| Financial Services | 13% |
| Healthcare | 13% |
| IT & Managed Services | 13% |
| Oil & Gas | 13% |
| Construction | 12% |
| Staffing & Recruiting | 12% |
| Engineering | 11% |
| Fintech | 11% |
| Solar | 11% |
| Legal Services | 10% |
| Real Estate | 10% |
In that report an MQL is a contact who has indicated intent to make a purchase — the examples given are filling out a contact form or reaching out by email — and who has been determined to be able to afford the product. An SQL is a lead who additionally moved through to sales with intent to buy, was vetted by a salesperson as a good fit, and met or booked a meeting with one.
Read the examples in the MQL definition, because they are not the signal most B2B teams actually score on. The report illustrates purchase intent with a contact form or a direct email — an approach to the company. It does not illustrate it with a content download. We come back to that below.
The shape of the table is more useful than any single row, and the spread is not a ranking of marketing competence. Our reading of it, which is a reading rather than the report’s own explanation: the industries at the top tend to be ones where the buyer arrives with an urgent, self-diagnosed, bounded need, and the industries at the bottom tend to be ones where the buying window opens on an event nobody controls. If your trigger is external and dated, a 12% conversion rate is not necessarily a leak.
One agency, two reports, and a 13% versus 38% answer for the same industry
Here is the finding none of the pages ranking for this question mention. The same publisher, drawing on the same client base, reports B2B SaaS at 13% in the study above and at a 28% to 46% band in its B2B SaaS funnel benchmarks, last updated June 2025. The median of that second set is 38%, close to three times the first number, for an industry label that reads identically.
| B2B SaaS vertical | MQL to SQL |
|---|---|
| Chemical / Pharmaceutical SaaS | 46% |
| Medtech | 43% |
| CRM | 42% |
| Fintech | 42% |
| Legaltech | 40% |
| Automotive SaaS | 39% |
| Entertainment SaaS | 39% |
| Industrial SaaS | 39% |
| Cybersecurity SaaS | 38% |
| Hospitality SaaS | 38% |
| Project Management SaaS | 37% |
| Retail / eCommerce SaaS | 36% |
| Adtech | 35% |
| Edtech | 35% |
| Telecom SaaS | 35% |
| Design SaaS | 34% |
| Insurance SaaS | 28% |
Nothing here is an error. Three things differ between the two reports, and each of them moves the number:
- The MQL bar. The first report requires purchase intent plus affordability. The second requires only that the lead fits the target market or a customer persona.
- The SQL bar. The first requires that a salesperson vetted the lead and a meeting was met or booked. The second requires that the lead has indicated the product is desirable and within budget and is speaking with a salesperson.
- The sample. The first spans 30 industries of agency client data gathered between 2019 and 2025. The second is 50-plus B2B SaaS clients, mostly $10M–$100M in revenue.
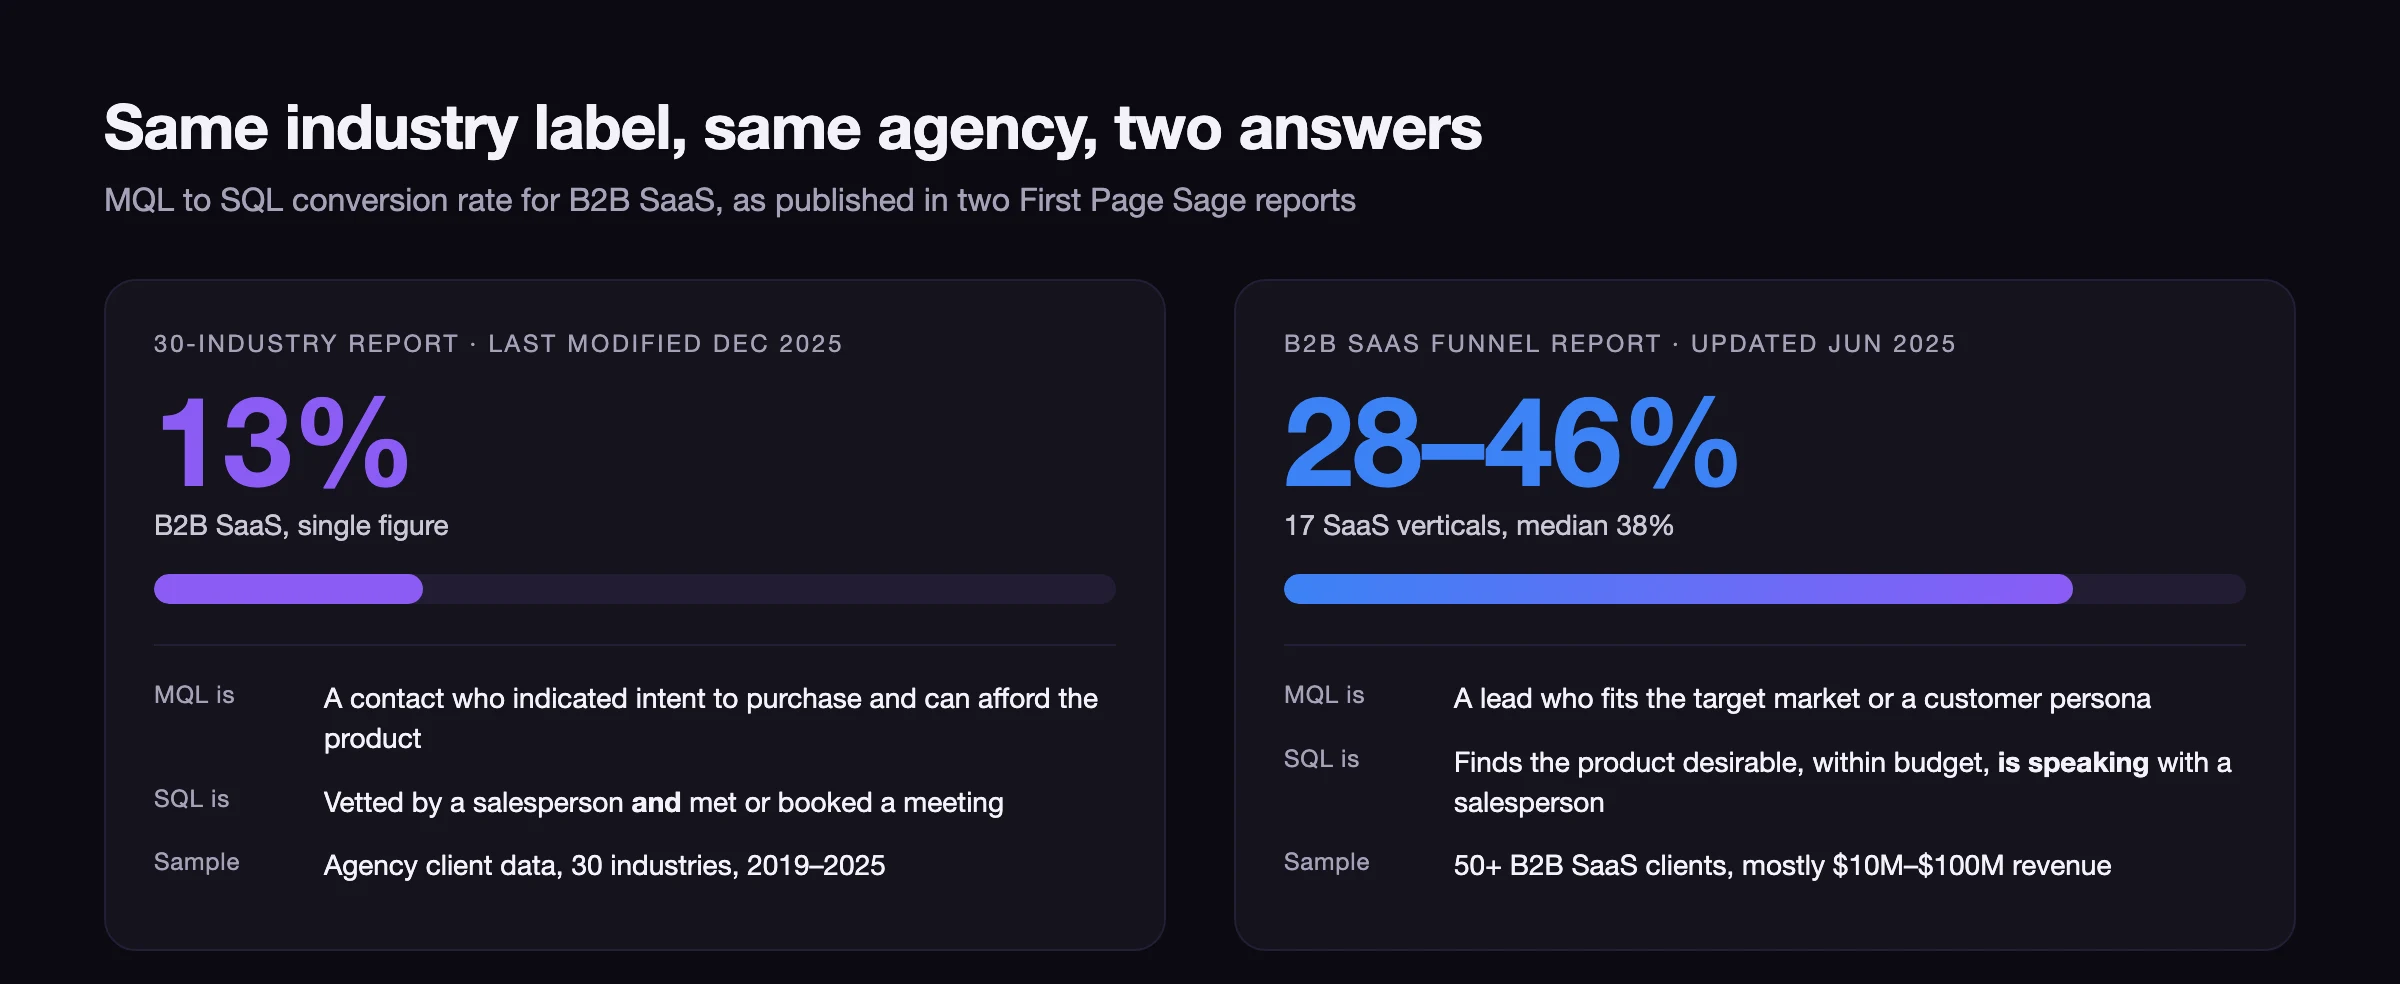
The practical consequence is uncomfortable and worth stating plainly: an external benchmark cannot tell you whether your funnel is healthy. Move your own MQL threshold by one scoring rule and you can produce either number from the same pipeline without a single extra deal. Benchmarks are useful for direction — insurance converts better than real estate, and that is real — and close to useless as a pass mark.
The number you should actually watch is your own rate over your own last four quarters, with the definition frozen. Which means the definition has to be written down somewhere both teams can point at.
How to calculate MQL to SQL conversion rate without fooling yourself
The formula is trivial:
MQL to SQL conversion rate = (SQLs accepted ÷ MQLs created) × 100
Two hundred MQLs, fifty accepted as SQLs, 25%. The arithmetic is not where people go wrong. The time window is.
The common mistake is dividing this month’s SQLs by this month’s MQLs. In a market with a sales cycle measured in weeks, those two numbers describe different groups of people. If MQL volume jumped in March, the March rate collapses; if volume fell in April, the April rate looks excellent. Both readings are artefacts.
Measure by cohort instead. Take every MQL created in a month, follow that specific set forward, and report the rate once the cohort has had a full sales cycle to mature. Then three rules keep it honest:
- Freeze the denominator. Every change to the scoring rule starts a new series. Note the date of the change in the same place you keep the number.
- Count acceptance, not activity. An SQL is created when sales accepts it, not when marketing sends it. If your CRM has no accept step, you do not have a measurable rate.
- Report rejections alongside it. A rate that rises because sales quietly stopped rejecting anything is not an improvement.
The five fields that make a lead genuinely sales-ready
Scoring models get complicated because they are built from what is easy to collect rather than what predicts a meeting. This is our own working checklist, not a benchmark: a lead is ready to hand over when a person could fill in all five fields from evidence, not from hope.
- A problem in the buyer’s words. Not a topic they read about — a sentence they said or wrote about something that is currently costing them something.
- Fit you can verify. Headcount, sector, geography, existing stack: the attributes on your ideal customer profile that can be checked against a source outside your own form.
- A budget holder in view. Either this person controls the money or they have named who does. “Interested individual at a good company” is not a qualification.
- A reason the timing is now. A renewal date, a launch, a regulation, a hire, a failure. Intent without a clock produces a polite call and no second one.
- An agreed next step. Something in a calendar with both names on it. This is the field most scoring models omit, and it is the one the benchmark definitions above actually require.
Fields one, three and four cannot be inferred from behaviour. They come out of a conversation, which is the honest argument for a qualification call sitting between MQL and SQL rather than a heavier scoring model.
Why a gated download is the weakest qualifying signal you can use
The most common way to manufacture an MQL is to put a PDF behind a form. The mechanism by which that depresses conversion is not mysterious.
A download is evidence of interest in the content. It is compatible with a student, a competitor, a consultant, a job applicant and a buyer, and the form cannot distinguish them. A pricing page visit followed by a contact form is evidence of interest in the purchase, and it is compatible with far fewer people. Both are one form fill. Only one of them is about you.
The definitions behind the benchmarks lean the same way. When the 30-industry report illustrates purchase intent, its examples are a contact form and a direct email, not a downloaded asset. That is an illustration rather than an exclusion — the report never says a download cannot qualify — but if your MQL rule is built on downloads, you are populating the same word with different people, and the comparison against that benchmark is weak before you start.
The channel data leans the same way too. In the lead-to-MQL report from the same publisher, last updated August 2025, client referrals convert at 56% and executive events at 54%, while webinars sit at 19% and podcasts at 21% — the lowest two of the digital channels measured, with only outdoor advertising at 14% below them. Ranking signals by how much buying evidence they carry:
| Signal | What it proves | Strength |
|---|---|---|
| Inbound demo or pricing enquiry | They want to buy something | Strongest |
| Referral from a customer or partner | Someone credible vouched for the fit | Strong |
| Repeat visits from a target account | The account is evaluating, even if the person is not | Strong |
| Reply to a direct approach | They chose to engage a human | Moderate |
| Webinar attended to the end plus a question | They spent time and revealed a problem | Moderate |
| Newsletter subscription | They want to keep reading | Weak |
| Single gated download | They wanted the file | Weakest |
The fix is not to delete the ebook. It is to stop the ebook from creating an MQL on its own. Let content build the audience, and let a second, purchase-shaped action promote someone out of it.
Channel arithmetic: when a bigger MQL count produces fewer meetings
MQL volume is the number most marketing dashboards lead with, and it is the number most likely to be wrong about what it implies. You can see why using nothing but the published B2B SaaS channel benchmarks and a calculator.
The table below takes the visitor-to-lead, lead-to-MQL and MQL-to-SQL rates published for five channels in the B2B SaaS funnel report and runs 1,000 visitors through each. The first three columns are published; the last two are multiplied out, so the arithmetic is checkable. Note that these lead-to-MQL rates come from a different report and a different sample than the channel figures in the previous section — webinars read 44% here and 19% there — which is the same definitional problem in miniature, and another reason not to mix sources inside one comparison.
| Channel | Visitor → lead | Lead → MQL | MQL → SQL | MQLs per 1,000 visitors | SQLs per 1,000 visitors |
|---|---|---|---|---|---|
| SEO | 2.1% | 41% | 51% | 8.6 | 4.4 |
| 2.2% | 38% | 30% | 8.4 | 2.5 | |
| 1.3% | 43% | 46% | 5.6 | 2.6 | |
| Webinar | 0.9% | 44% | 39% | 4.0 | 1.5 |
| PPC | 0.7% | 36% | 26% | 2.5 | 0.7 |
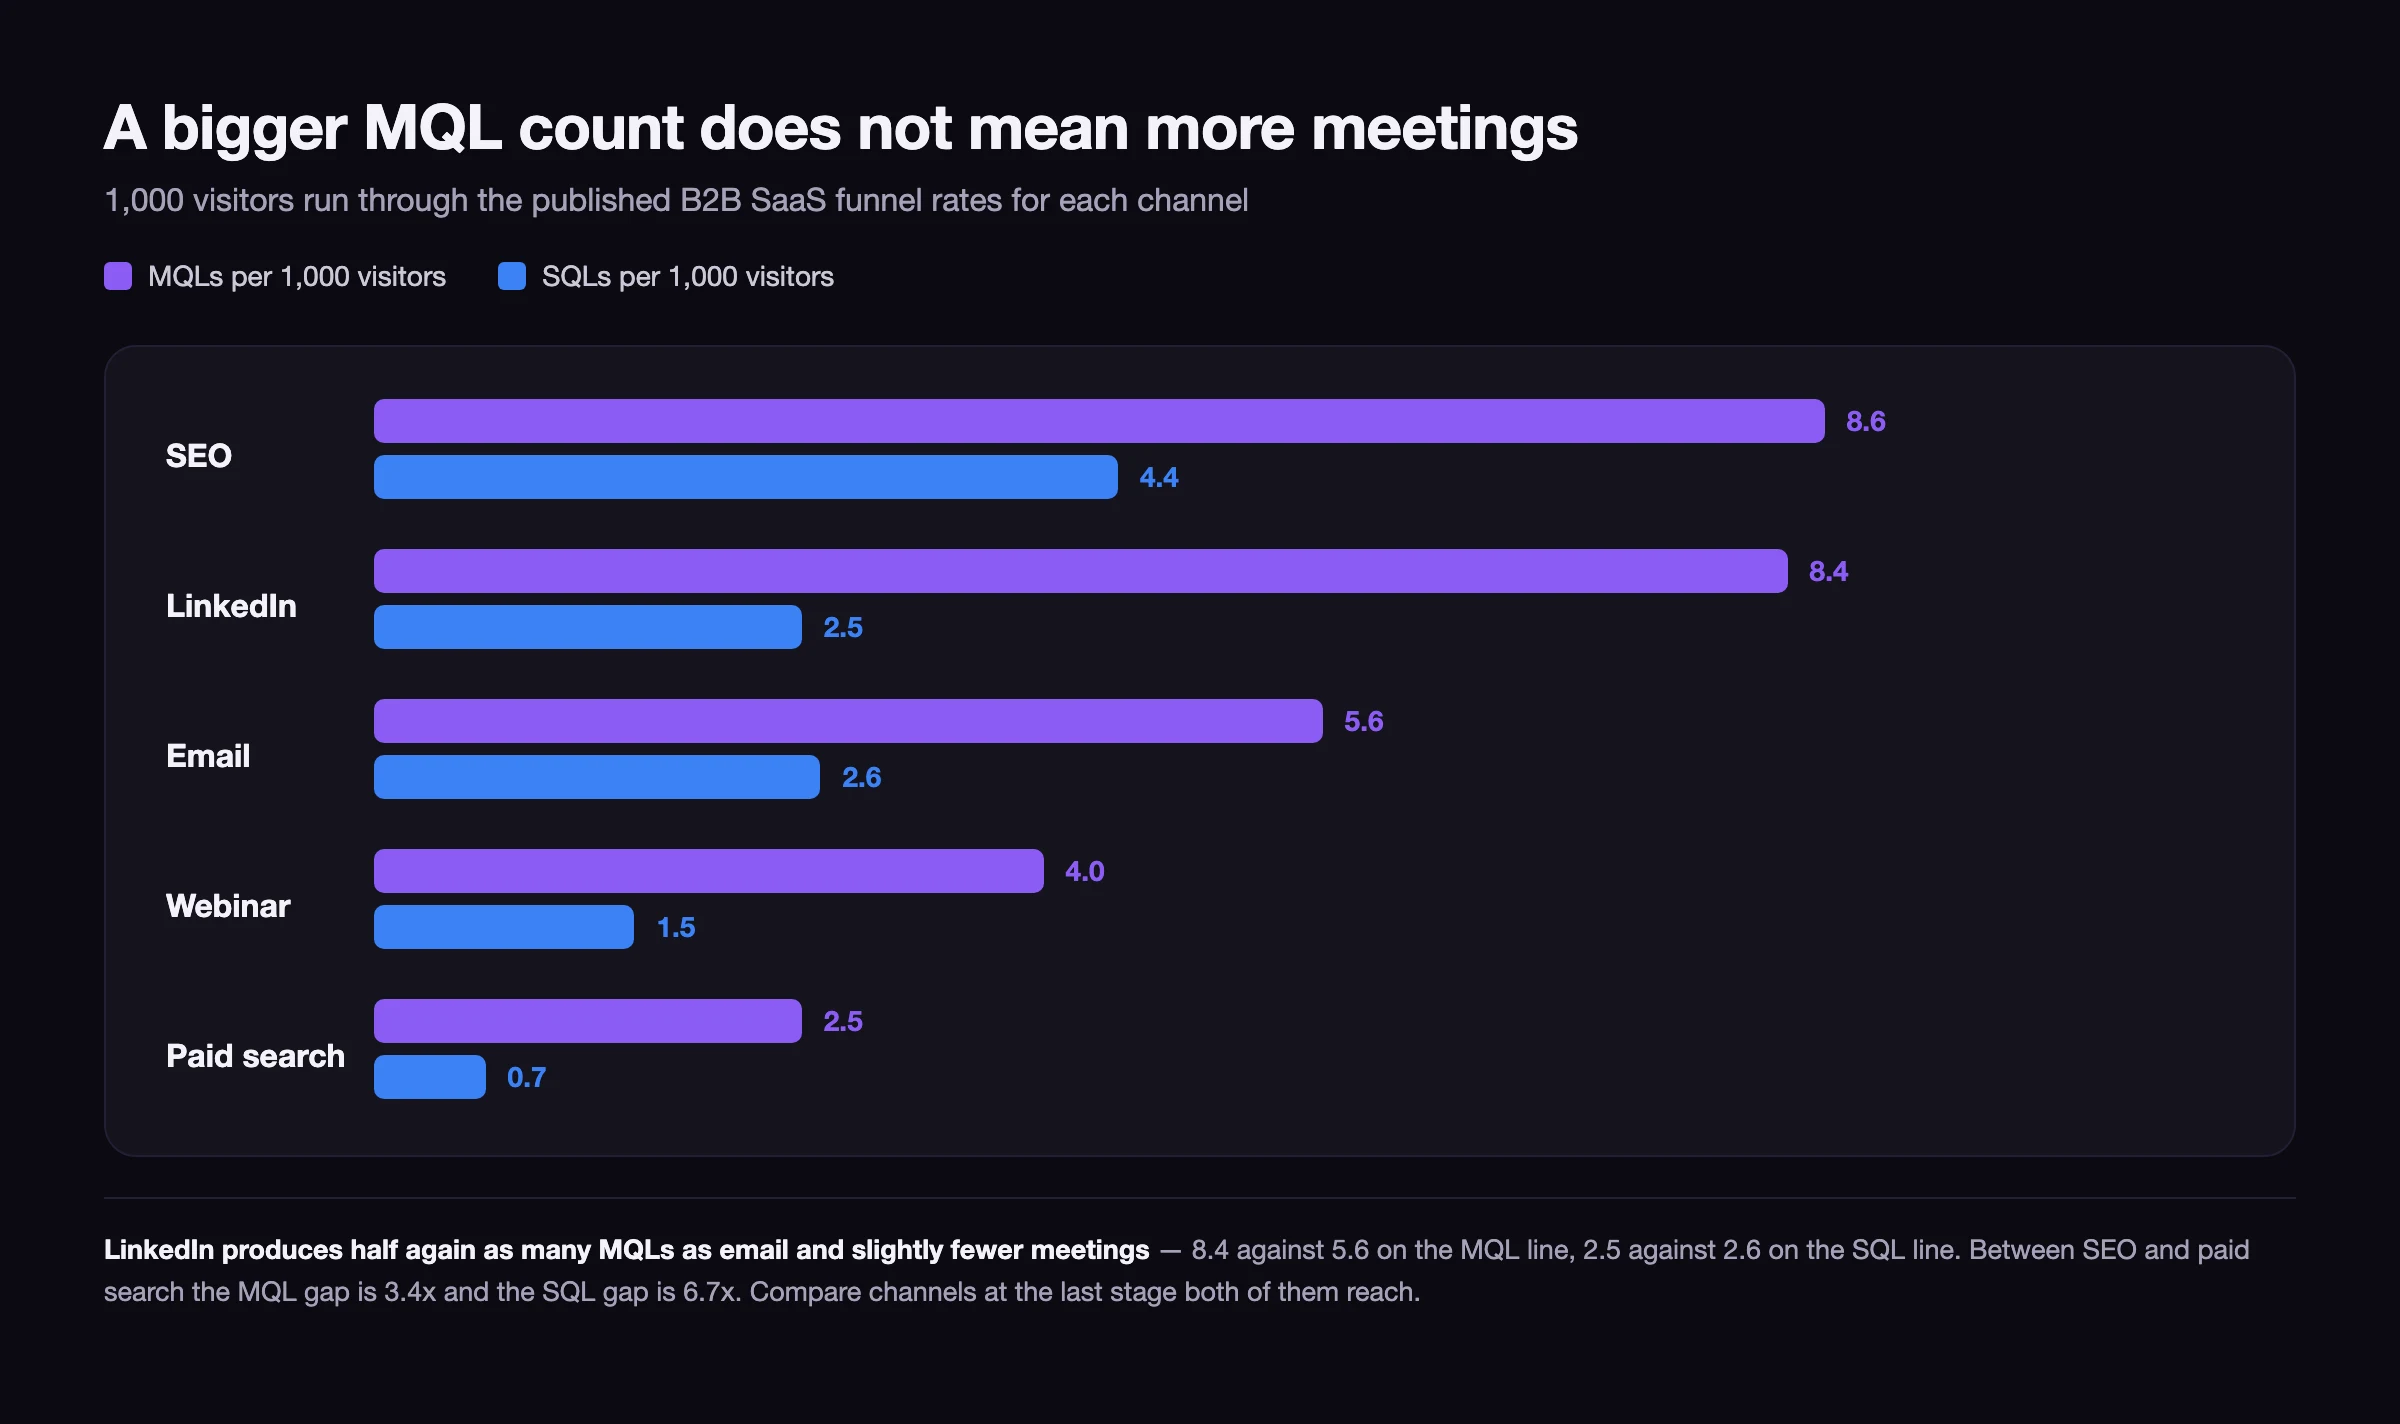
Two readings fall out of it.
LinkedIn produces half again as many MQLs as email and slightly fewer meetings. 8.4 against 5.6 on the MQL line looks like a decisive win. On the SQL line it is 2.5 against 2.6, and email is marginally ahead. A dashboard that reports MQLs would have moved budget in the wrong direction.
Between SEO and paid search, the MQL gap understates the real gap by half. SEO produces 3.4 times the MQLs of PPC in this data and 6.7 times the SQLs, because the qualification rate compounds on top of the volume difference. That compounding is also why cost per lead is such a poor way to compare channels — the cheap lead and the expensive lead are not the same object, which is a large part of why the true cost of a Google Ads click tells you so little on its own. Cost per lead and sales cycle length each deserve their own treatment and get a paragraph here at most.
The general rule: a channel comparison is only valid at the last stage both channels reach. If your teams disagree about which channel works, the disagreement almost always dissolves when someone recalculates at the SQL line instead of the MQL line.
When marketing and sales count differently: the definition contract
Most MQL-versus-SQL arguments are not disagreements about lead quality. They are two teams reading two different numbers, each correctly, and assuming the other is wrong.
The symptoms are recognisable. Marketing reports a good month and sales says the pipeline is empty. The CRM and the marketing automation platform show different MQL counts for the same period. Sales works leads it likes and ignores the rest without recording why, so the rejection rate reads as zero and the acceptance rate is fiction.
The fix is administrative, not strategic. Write one page, agree it in a meeting where both leads are present, and store it where the dashboard lives. Six fields:
- MQL definition. The exact rule, including which actions do and do not qualify, written so that someone outside both teams could apply it.
- SQL definition. What a salesperson has to have confirmed before accepting. Name the fields.
- Who creates each record, and in which system. One system of record per stage. Two counts of the same stage guarantees the argument returns.
- Response window. How long sales has to make first contact, and what happens to the lead if the window is missed.
- Rejection reasons. A short closed list, covered in the next section. Rejection must be a button, not an opinion.
- Review date. A quarter is right. Any change to the MQL rule restarts the measurement series.
Two habits keep it alive. Review rejected leads together every month — most definition problems are visible in twenty rejected records and invisible in a chart. And put a named owner on the document, because a shared definition with no owner reverts to two definitions within a quarter.
The rejection loop, and the seven reasons sales should be allowed to send back
A qualification process without a working rejection path is not a process. If sales cannot formally return a lead, it returns it informally — by not calling — and marketing never learns what was wrong.
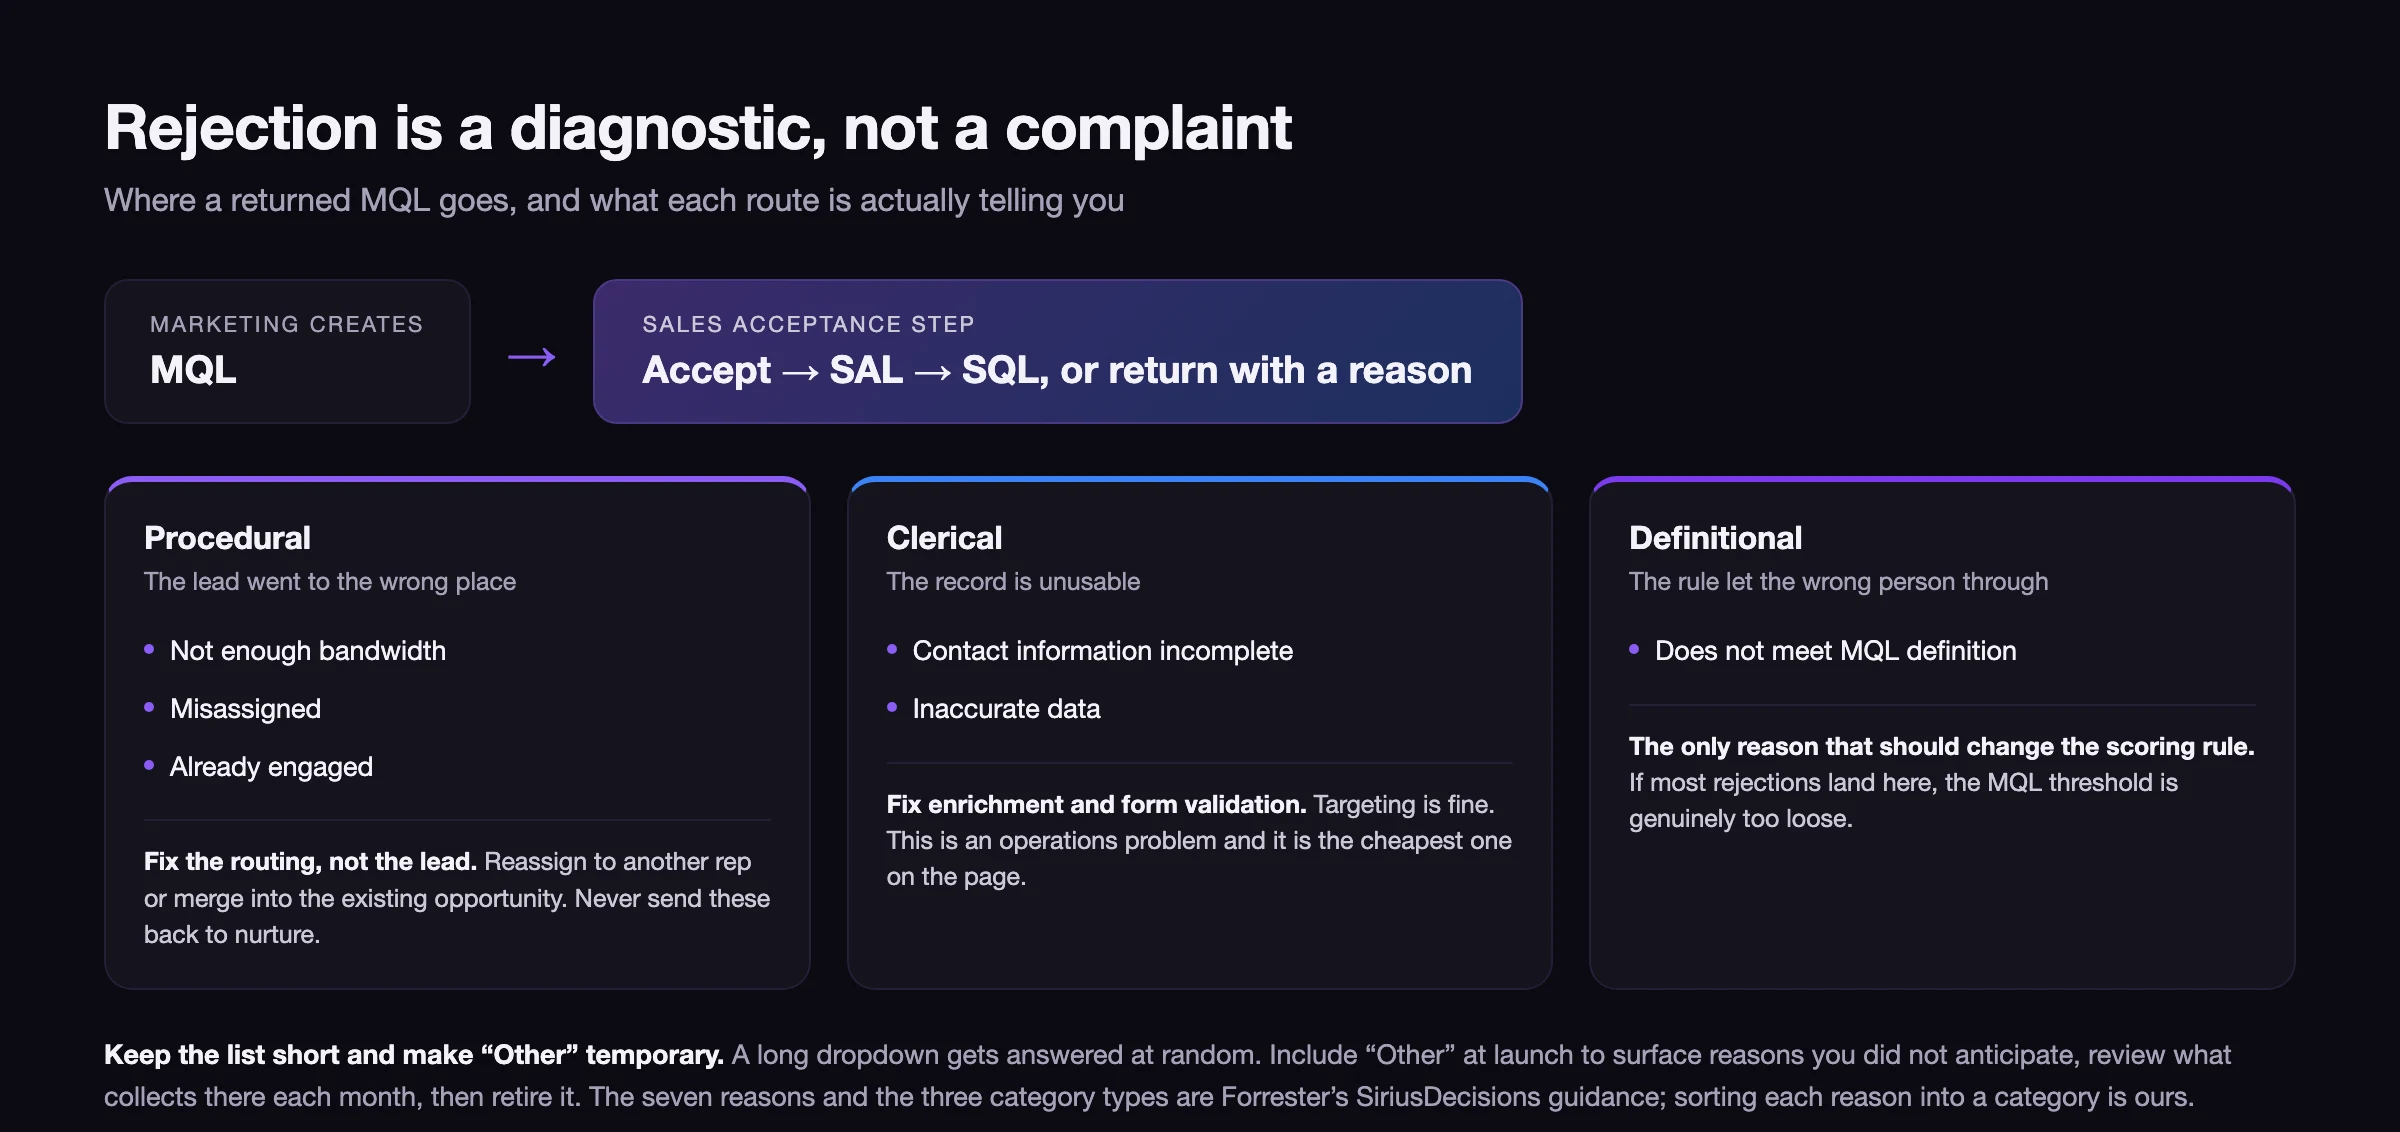
Forrester’s SiriusDecisions research groups the reasons for rejecting an MQL into three types: procedural (the lead was routed incorrectly), clerical (the record is incomplete or inaccurate) and definitional (the lead does not meet the agreed thresholds). Its published list of reasons to offer sales runs to seven. The seven reasons and the three categories are Forrester’s; sorting each reason into a category, and the response column, are ours:
| Rejection reason | Type | What it should trigger |
|---|---|---|
| Not enough bandwidth | Procedural | Reassign to another rep or a partner, not back to nurture |
| Contact information incomplete | Clerical | Enrichment, then re-route |
| Misassigned | Procedural | Correct the routing rule, not just this record |
| Inaccurate data | Clerical | Form validation review |
| Already engaged | Procedural | Merge into the existing opportunity |
| Does not meet MQL definition | Definitional | The only reason that should change the scoring rule |
| Other | — | Review monthly, promote recurring cases, retire the category |
Two details in that guidance are easy to miss and worth copying. The list should be short, because a long dropdown gets answered at random. And “Other” is meant to be temporary: you include it at launch to discover reasons you did not anticipate, review what accumulates there, and then phase it out.
The diagnostic value is immediate. If most rejections are clerical or procedural, marketing’s targeting is fine and your operations are broken — cheap to fix, and no scoring model needed. If most are definitional, the MQL rule is genuinely too loose. Those two problems look identical on a conversion chart and have nothing in common.
How fast the handoff has to move
Speed belongs in the definition contract because it changes the conversion rate more reliably than most scoring work does.
The reference study is old but has never been convincingly displaced: Harvard Business Review’s The Short Life of Online Sales Leads, published in March 2011 by James Oldroyd, Kristina McElheran and David Elkington, audited 2,241 US companies with test web leads. Firms that made contact within an hour were nearly seven times more likely to qualify the lead than firms that got to it even an hour later, and more than 60 times more likely than those that waited 24 hours or more. “Qualify” there means reaching a meaningful conversation with a key decision maker.
Treat those multiples as a shape rather than a forecast — the study is from 2011, the sample was US web leads, and the buying behaviour around it has changed. The shape has not: qualification odds decay steeply, and they decay fastest at the start.
Three practical consequences:
- The response window is part of the MQL definition, not a separate service level. A lead that will not be contacted for three days should not have been created as an MQL on a Friday afternoon.
- Route by speed, not by seniority. The best available rep now beats the ideal rep on Tuesday.
- Measure time to first contact by cohort, next to the conversion rate. When the rate moves, this is the first column to check, before anyone reopens the scoring model.
Where SAL, PQL and opportunity sit around the MQL and SQL pair
The two-term version is a simplification, and people search for “MQL vs SQL vs SAL” and “MQL vs SQL vs opportunity” precisely where it runs out. The full sequence, in the order records move:
| Stage | Created by | The test it passes |
|---|---|---|
| Lead | Marketing | Contact details submitted, not spam |
| MQL | Marketing | Matches the buyer profile and behaviour rule |
| SAL (sales accepted lead) | Sales | Sales has formally accepted it for work |
| SQL (sales qualified lead) | Sales | Problem, budget and timing confirmed in conversation |
| Opportunity | Sales | A deal with a value and a close date in the forecast |
| Closed | Sales | Signed |
SAL is the stage most teams skip and most need. It separates “sales agreed to work this” from “sales agreed this is real”, and it is the stage where the rejection reasons above get recorded. Without it, the MQL to SQL rate mixes leads sales never touched with leads sales touched and disqualified — two entirely different problems averaged into one number.
PQL (product qualified lead) is a parallel track, not a step. In products with a free tier or trial, the qualifying evidence is usage rather than marketing engagement: a team invited three colleagues, hit a plan limit, or used the feature that correlates with paying. A PQL is often routed in at or near the SQL line rather than the MQL line, because usage is behaviour inside the product rather than interest in the marketing around it.
One structural note that applies to every stage above. In enterprise deals the qualified unit is rarely a person — it is a buying group, and the individual who filled in your form may be researching on behalf of people you have not met. That is a large part of why per-lead qualification behaves differently in enterprise pipelines than in transactional ones, and it is the assumption we design around when we build B2B and enterprise demand programmes.
If you change one thing after reading this, make it the smallest one: write down the two definitions, date them, and put a rejection dropdown in the CRM. Almost every argument about lead quality resolves against those three artefacts, and none of them requires new software.
12 / Reader questions
Frequently asked questions
01What is the difference between an MQL and an SQL?
An MQL is a marketing qualified lead: someone whose behaviour and profile match your buyer, judged by marketing. An SQL is a sales qualified lead: the same person after a salesperson has verified a real problem, a real budget and a real timeline. Marketing scores an MQL; a human confirms an SQL.
02What comes first, MQL or SQL?
MQL comes first in the standard funnel: visitor, lead, MQL, SQL, opportunity, closed. But the sequence is not mandatory. Inbound demo requests, referrals and returning customers routinely arrive already qualified and should skip the nurture track rather than be routed backwards into it.
03What is a good MQL to SQL conversion rate?
There is no single good number, because the rate depends entirely on where you draw both lines. Published cross-industry benchmarks run from 10% to 26%, while B2B SaaS funnel benchmarks using a looser MQL definition run from 28% to 46%. Compare against your own last four quarters, not against a table.
04How do you calculate MQL to SQL conversion rate?
Divide the number of MQLs accepted as SQLs by the number of MQLs created, then multiply by 100. The trap is the time window: measure by cohort, so leads created in a month are tracked forward, rather than dividing this month's SQLs by this month's MQLs.
05What are examples of a marketing qualified lead?
Common triggers are a pricing page visit followed by a contact form, a demo request, a repeat visit from a target account, or a webinar attendee who stayed to the end and asked a question. A single ebook download is a weak example and is a frequent cause of low conversion.
06Is SQL here the same as the database language?
No. In marketing and sales, SQL means sales qualified lead. Structured Query Language is an unrelated term that shares the abbreviation. If a page mixes the two, it is aggregating two audiences that have nothing to do with each other.