
Published
The standard customer lifetime value formula is average order value × purchase frequency × average customer lifespan. It produces a revenue figure over an invented time horizon. The version below is bounded to 12 and 24 months, runs on a single acquisition cohort, and subtracts returns, cost of goods and return handling — so it can actually be checked against the books.
How this was checked. For this search in the United States on 10 August 2026, Google leads with an AI Overview giving the formula as average purchase value × purchase frequency × average customer lifespan. The seven organic results under it that day — Wall Street Prep, Salesforce, IBM, ChurnZero, Twilio, Zendesk and Wharton Executive Education — each publish a version of the same equation, and none of the seven presents a variant that subtracts returns. The worked example below is illustrative rather than a set of client books: its benchmark inputs are named and dated, and the figures that are assumptions rather than benchmarks — the $85 order value, the 10% discount rate and the year-two order count — are flagged where they appear.
In that example, a cohort of 1,000 apparel customers generates $102.77 of gross revenue each over twelve months and $28.77 of contribution — 28% survives the trip. The same cohort put through the textbook formula with a three-year lifespan returns $308.30. The gap is 10.7×, and none of it comes from the customers behaving differently.
What the standard customer lifetime value formula leaves out
The equation itself is not wrong. It is an accounting identity: spend per order, times orders per period, times periods. The problem is what each term quietly is.
- Average order value is gross. It is the number on the order confirmation, before anyone sends anything back. In apparel, where the published return band runs 20–40% of online revenue, a gross figure overstates the net one by 25% at the bottom of that band and by 67% at the top.
- The output is revenue, not profit. Multiplying three revenue terms cannot produce a margin figure. Several of the pages ranking for this query define the metric as “net revenue or profit” and then demonstrate a calculation that is neither.
- Average customer lifespan is not measured, it is assumed. This is the term that does the damage, because it is a multiplier and it is unbounded.
There is a fourth omission that only shows up in operations. A refund is not a neutral reversal. The order value comes off revenue and a separate cost lands on the P&L: return shipping, receiving and inspection labour, restocking, and a markdown when the item cannot go back on the shelf at full price. One published breakdown works a $60 apparel order through that chain — $8 of return shipping, $3 of inspection labour, a $12 markdown — and arrives at an $83 event, meaning $23 of cost on top of the $60 that left. That is 38% of the refunded order’s value. The revenue leaves and the cost arrives, and the formula sees neither.
If your purchase values reach analytics through a browser pixel rather than a server-side feed, there is a fifth problem underneath all of this: refunds are recorded in the order system days or weeks later and never propagate backwards into the pixel’s numbers. Server-side event forwarding is the fix, and it is a subject in its own right.
Why average customer lifespan is the weakest number in the equation
Lifespan is usually written as 1 ÷ churn rate. That identity is exact only under one condition: that the probability of a customer leaving is constant in every period. Gupta and Lehmann, in work cited in the 2006 Journal of Service Research review of lifetime value modelling by Gupta, Hanssens, Hardie and colleagues, showed that “using an expected customer lifetime generally overestimates CLV, sometimes quite substantially.” That same review draws the distinction that matters most for ecommerce: in contractual settings such as subscriptions, customers tell you when they leave; in non-contractual settings such as a store, “a firm has to infer whether a customer is still active.” Nobody cancels an apparel brand. They just stop.
Cohort data shows why a constant-churn assumption fails. A direct-to-consumer agency dataset covering 156,110 customers across more than ten categories, measured on a 365-day lookback, reports a repeat purchase rate of 18.8% blended — roughly one customer in five places a second order at all — and splits into 22–44% for consumables, 10–17% for fashion and 7–18% for durables. The timing inside that year is more revealing than the rate:
| Repeat purchases | Share of all repeat purchases in the dataset |
|---|---|
| Placed within 30 days of the first order | 50.3% |
| Placed within 90 days | 76.4% |
| Placed after more than a year | 3.7% |
Source: BS&Co, repeat purchase benchmarks, 156,110 customers, 365-day lookback, 10+ direct-to-consumer verticals. The 3.7% figure sits awkwardly against a 365-day window, which is itself the point: a one-year lookback cannot see year two, and almost nobody publishes a dataset that can.
Half the repeat behaviour that exists lands in the first month and three quarters inside the first quarter. Set that against a three-year lifespan assumption. A model that keeps a customer buying at year-one frequency through year three is not projecting from the shape of the curve — it is extending a flat line across two years nobody in this dataset observed.
The honest version of the lifespan term is a window you choose and then verify. Twelve months is the shortest window that captures the repeat behaviour that exists; twenty-four months reaches into the tail, at the price of waiting two years to check the answer.
The cohort customer lifetime value calculation, in eleven rows
This is the calculation itself. Every row is either pulled straight from an order table or derived from a row above it. The right-hand column carries the worked example, described in full in the next section.
| Row | What to pull | Where it comes from | Worked example, 12 months |
|---|---|---|---|
| A | Cohort size — customers whose first order fell in one calendar month | Order table, first-order date per customer | 1,000 |
| B | Orders that same cohort placed inside the window | Order table, filtered by those customer IDs | 1,209 |
| C | Gross revenue from those orders, before refunds | Order totals, summed | $102,765 |
| D | Gross average order value — C ÷ B | Derived | $85.00 |
| E | Orders per customer — B ÷ A | Derived | 1.209 |
| F | Return rate on a revenue basis — refunded value ÷ C | Refund or credit-note table | 30% |
| G | Net revenue — C × (1 − F) | Derived | $71,936 |
| H | Gross margin on net revenue | Product costs or P&L | 55% |
| I | Gross profit — G × H | Derived | $39,565 |
| J | Return handling cost — C × F × 35% | 3PL invoices, markdown log | $10,790 |
| K | Margin lifetime value per customer — (I − J) ÷ A | Derived | $28.77 |
Four notes on where this goes wrong in practice.
Cohort by first order, not by order date. If row B counts every order placed in a month, repeat orders from customers acquired two years ago land in a cohort they do not belong to, and the number drifts upward every month the brand ages.
Return rate on revenue, not units. Units and dollars diverge sharply when the expensive items come back more often than the cheap ones, which in apparel is the normal case.
Row H is the one most likely to be flattering. Gross margin applies to net revenue here, which assumes returned goods recover their cost of goods — the item comes back and can be sold again. Anything destroyed or liquidated belongs in row J instead. And a private P&L that counts only product cost typically shows a gross margin 8 to 15 points higher than the fully loaded figure a public company reports, because inbound freight, duties and shrinkage never make it into the line. If your 55% is not fully loaded, row K is optimistic.
Row J is a real invoice, not an estimate, if you look for it. The 35% handling rate above is a deliberately conservative stand-in, set below the 38% that the one published breakdown implies. Your own figure sits in 3PL billing and in the markdown log, and it is worth an hour to find, because it is the difference between a margin number and a slightly better revenue number.
Margin lifetime value: what a return actually removes from the number
The scale of the correction depends on category, and the spread is wide enough that a single blended assumption is useless.
Across United States retail as a whole, the National Retail Federation and Happy Returns projected in their 2025 Retail Returns Landscape, released October 2025, that consumers would return $849.9 billion of merchandise in 2025 — 15.8% of sales, down from 16.9% the year before. Online is materially worse: the same report estimates 19.3% of online sales will be returned, and puts 9% of all returns as fraudulent. These are projections and retailer estimates, not settled full-year accounts.
| Category | Typical online return rate |
|---|---|
| Apparel | 20–40% |
| Footwear | 17–30% |
| Home and furniture | 15–23% |
| Accessories and jewellery | 12–15% |
| Electronics | 8–15% |
| Beauty and personal care | 4–12% |
Category ranges as compiled by Richpanel from 2025–2026 ecommerce returns benchmark datasets; the all-online 19.3% anchor is NRF and Happy Returns, October 2025. The ranges are wide because sources differ on what counts as a return.
The margin side has a comparable spread. Eightx’s review of eleven publicly traded direct-to-consumer and consumer-goods brands puts the median gross margin at 56.6%, with a quartile range of 45.6% to 63.8% — beauty near 70%, apparel and outdoor clustering in the mid-50s, food far below.
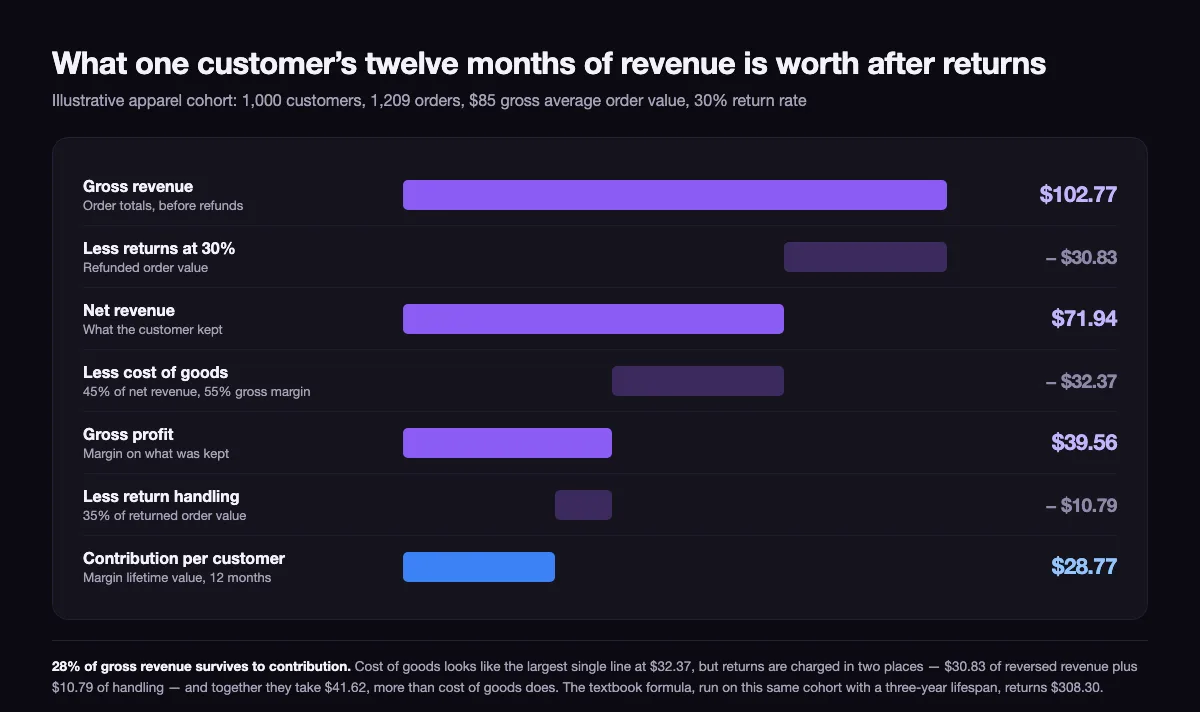
Put those together and the arithmetic on the example cohort runs: $102.77 gross, less 30% returns leaves $71.94 net, 55% margin on that leaves $39.56 of gross profit, less $10.79 of return handling leaves $28.77 of contribution per customer.
The order of the deductions is worth reading twice. Cost of goods removes $32.37 and looks like the biggest line. But returns are charged in two places — $30.83 of reversed revenue plus $10.79 of handling — and together they take $41.62, more than cost of goods does. In a category at the top of the apparel band, they take more than everything else combined.
A worked example: one cohort, five numbers
Same 1,000 customers, same orders, five ways of expressing what they are worth.
The cohort places 1,209 orders in twelve months: 1,000 first orders, then 150 second, 45 third and 14 fourth. A 15% second-order rate sits inside the 10–17% fashion band above rather than on the 18.8% all-category blend, because this is an apparel cohort. The 61 further orders in months 13 to 24 are an assumption rather than a benchmark, and a deliberately generous one: the 3.7% tail in the table above implies roughly eight late orders on a cohort this size, not sixty-one. The year-two row below is therefore an upper bound, which makes what it adds more telling, not less.
| Calculation | What it assumes | Per customer | Verifiable when |
|---|---|---|---|
| Textbook, three-year lifespan: $85 × 1.209 × 3 | Buying continues at year-one frequency for three years | $308.30 | Year three, if the brand still exists |
| Textbook, lifespan = 1 ÷ churn, at the 85% churn implied by this cohort’s own repeat rate: $85 × 1.209 ÷ 0.85 | Churn is constant across periods | $120.90 | Never — a store does not observe churn |
| Cohort revenue lifetime value, 12 months | Nothing beyond the window | $102.77 | Twelve months |
| Cohort margin lifetime value, 12 months | Returns, cost of goods and handling all counted | $28.77 | Twelve months |
| Cohort margin lifetime value, 24 months, discounted at 10% | As above, plus year-two orders discounted to today | $30.09 | Twenty-four months |
Inputs: gross average order value $85; revenue-basis return rate 30%, the midpoint of the apparel band; gross margin 55% on net revenue; return handling at 35% of returned order value; an assumed annual discount rate of 10%, applied only to the 24-month row. The two textbook rows are undiscounted, exactly as they are usually published.
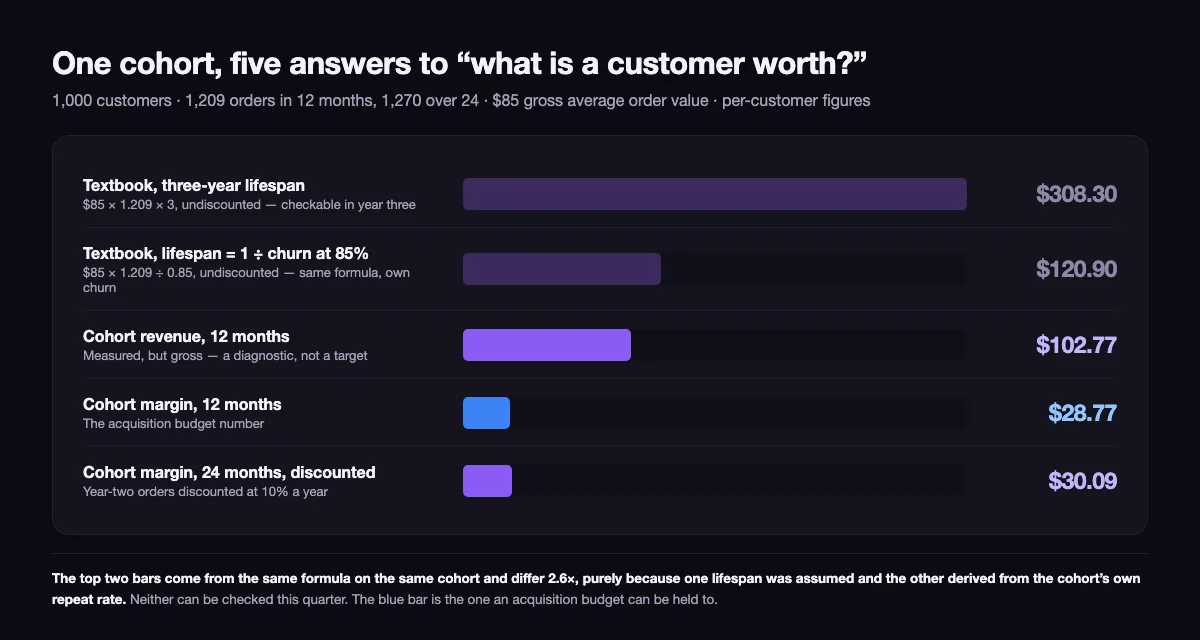
Two things are worth noticing. The first is the gap between the two textbook rows: $308.30 and $120.90 come from the same formula on the same cohort, and differ 2.6× purely because one lifespan was assumed and the other inferred from the cohort’s own repeat rate. A formula whose answer swings that far on an unstated input is not a measurement.
The second is how little year two adds. Twelve extra months of orders lift contribution from $28.77 to $30.23, and to $30.09 once discounted — $1.32, or 4.6%. That is on the generous year-two assumption above; on the eight orders the published tail implies, it would be under one percent. Waiting a further year to be sure of the number buys almost nothing.
Which number belongs in which decision
The two figures answer different questions, and using the wrong one has a predictable failure mode.
Margin lifetime value at 12 months is the acquisition budget number. It is the ceiling on what a customer can be worth inside a horizon your cash flow can survive. Anything you pay above it has to be funded by something other than that customer. This is the figure that belongs beside your channel costs — what a click actually costs on Google Ads is only interpretable next to a bounded value figure, not next to a three-year projection.
Revenue lifetime value is a diagnostic, not a target. It is useful for comparing cohorts against each other, because the distortions are constant across them. It is useless as a payback threshold.
Long-horizon projections belong in planning, clearly labelled as projections. If a three-year figure appears in a document, it should carry its assumed lifespan and discount rate on the same line. The 2006 review cited above notes that at 90% retention and a 12% discount rate the margin multiple works out at about four, and that a one-percentage-point change in retention moved customer equity by almost 5% against 0.9% for an equivalent change in the discount rate. The retention assumption is where the sensitivity lives, which is exactly why it should not be a guess. Where those figures land in practice is a marketing plan built backwards from revenue.
Two adjacent numbers deserve their own treatment rather than a paragraph here: what it costs to acquire the customer in the first place, and how to lift average order value without buying the increase with conversion rate. Each is a separate calculation with its own traps.
Brands that get this right tend to be the ones running the arithmetic monthly rather than annually, which is a reporting habit more than an analytics capability — and it is the habit behind most of the ecommerce and direct-to-consumer work that survives its first bad quarter.
Customer lifetime value, CLV, CLTV and LTV: which term means what
Four labels circulate for one idea, and one of them is genuinely ambiguous.
- Customer lifetime value is the full term and the safe one.
- CLV and CLTV are unambiguous abbreviations of it. CLTV is the more common form in subscription reporting.
- LTV is the problem. In finance it means loan-to-value — a mortgage divided by the appraised value of the property. This is not a hypothetical collision. On the search that produced this article, Google’s own related-questions block served an Investopedia page defining the loan-to-value ratio alongside questions about customer value. And United States keyword data for August 2026 puts the bare three letters at roughly 12,100 monthly searches against 4,400 for customer lifetime value written out — with the mortgage phrasings, not the marketing ones, sitting at the top of that larger number.
The practical rule is short. Write customer lifetime value in full on first use in any document that leaves your team, then use CLV or CLTV. Reserve LTV for conversations where the context is unmistakable, or drop it entirely.
08 / Reader questions
Frequently asked questions
01What is the customer lifetime value formula?
The formula quoted almost everywhere is customer lifetime value = average order value × purchase frequency × average customer lifespan. It returns gross revenue, not profit, and it depends on a lifespan figure that most ecommerce brands cannot observe. A bounded alternative is to measure one acquisition cohort over a fixed 12- or 24-month window and subtract returns, cost of goods and return handling.
02How do you calculate customer lifetime value with a discount rate?
Discount each future period's contribution back to today before adding it up: divide year-two contribution by 1 plus the annual rate, year three by that figure squared, and so on. At a 10% rate, a dollar of year-two contribution is worth 91 cents today. Over a 24-month window the effect is small — in the worked example above it moves margin lifetime value from $30.23 to $30.09.
03Is customer lifetime value CLV or LTV?
Both are used for the same idea, and CLTV is a third variant. CLV and CLTV are unambiguous; LTV is not, because in finance LTV means loan-to-value, the ratio of a mortgage to the appraised value of the property. Google's own related questions on this search mix the two. Write customer lifetime value in full the first time and the ambiguity disappears.
04What is a good LTV to CAC ratio?
Three to one is the figure most often quoted, and Geckoboard names 3× or higher as the industry standard for growing SaaS companies. Two cautions before importing it into ecommerce: the ratio only means something if the numerator is margin lifetime value rather than revenue, and a very high ratio usually signals underspending on acquisition rather than efficiency.
05What is the customer lifespan formula?
Average customer lifespan is usually written as 1 ÷ churn rate. That identity holds only when the chance of a customer leaving is the same in every period. Real ecommerce cohorts churn hardest immediately after the first order, and non-subscription stores never observe churn at all — nobody cancels, they just stop buying — so the figure is an assumption dressed as a measurement.
06How do you build a customer lifetime value calculation in Excel?
Export three columns — customer ID, order date, order total — plus a refund column, then filter to customers whose first order falls in one month. That is your cohort. Sum the orders those same customer IDs placed within 12 months of their first, subtract refunded value, apply gross margin, subtract return handling, and divide by the number of customers in the cohort.
07What is a good customer lifetime value?
There is no absolute benchmark, because the figure scales with price point and category. What matters is the ratio between margin lifetime value and acquisition cost, and whether the 12-month cohort figure rises cohort over cohort. A brand at $29 of 12-month margin lifetime value against $10 of acquisition cost sits at 2.9:1 — just under the 3:1 rule of thumb, and a real answer it can act on. One quoting $300 of revenue lifetime value with no margin math behind it cannot tell you where it sits at all.