
Published
A product-market fit survey asks active users one question: how would you feel if you could no longer use this product? The percentage answering very disappointed is your score, and 40% is the conventional pass mark. Most teams who run it land somewhere between 25% and 39% — and at the sample sizes most teams use, that result is not yet a finding.
How this was checked. For this query in the United States on 10 August 2026, Google returned an AI Overview, a People Also Ask block, a video pack, a Reddit discussion module and an organic page led by Pendo’s help centre, the pmfsurvey.com tool, First Round Review’s Superhuman case study, Formbricks, Learning Loop, Attest and SatisMeter. Between them they cover the question wording, the follow-ups and the 40% rule. Not one of them tells you what a score of 33% actually licenses you to conclude, and the sample-size advice on the page — the AI Overview recommends 40 to 100 responses — is roughly a quarter of what the test needs to answer its own question. The confidence intervals below were computed for this article; the method is stated where they appear.
The one question a product-market fit survey is built on
Everything else in the survey is context. The measurement is a single multiple-choice item:
How would you feel if you could no longer use [product]?
- Very disappointed
- Somewhat disappointed
- Not disappointed (it isn’t really that useful)
- N/A — I no longer use the product
Your score is the share of qualified respondents who pick the first option. Nothing is weighted, nothing is averaged, and the other three options exist mainly to give the first one a denominator and to catch people who should never have been in the sample.
The item works because it asks about loss rather than approval. Approval is cheap — people rate things well to be pleasant. Losing a tool you have built a workflow around is a concrete, imaginable cost, and answers cluster much more honestly around it. That is also what separates this item from the two metrics teams usually already have:
| Product-market fit item | Net Promoter Score | Customer satisfaction | |
|---|---|---|---|
| Asks about | Personal loss if it disappeared | Willingness to recommend to others | Contentment with a recent experience |
| Answer scale | Four options, one of them counted | 0-10, grouped into three bands | Usually 1-5 |
| Reported as | % choosing “very disappointed” | Promoters minus detractors | Mean or % top-box |
| Sensitive to | Whether the product is load-bearing | Reputation, social risk, timing | The last interaction, not the product |
| Answers the question | Is this a must-have yet? | Would people vouch for us? | Did this go well? |
A product can hold a healthy satisfaction score while nobody would miss it. That gap is precisely what this survey is for.
Where the 40% benchmark came from, and what it does not claim
Sean Ellis developed the item while doing early growth work across a run of startups, and arrived at the threshold empirically: after benchmarking close to a hundred companies, he found that those which struggled to grow almost always had fewer than 40% of users answer “very disappointed”, while those with strong traction almost always exceeded it.
Read that sentence carefully, because it is weaker than how it is usually repeated. It is a pattern observed across a private sample, described in prose, with “almost always” doing real work. The research team at MeasuringU went looking for the underlying evidence and reported that they could not find any peer-reviewed papers describing research with the product-market fit item or the Sean Ellis test at all.
So the honest status of 40% is this: a decision line drawn from practitioner experience, described in prose rather than in a paper, that has been useful enough to stay in wide use ever since. That is a genuinely good reason to adopt it. It is not a reason to treat 39% and 41% as different states of the world — and as the next section shows, at ordinary sample sizes they are not even different measurements.
The full product-market fit survey questions, ready to paste into a form
Six questions. The first produces the number; the rest produce everything you will actually act on. Anything longer depresses completion without adding decisions.
| # | Question | Type | What it feeds |
|---|---|---|---|
| 1 | How would you feel if you could no longer use [product]? | Four options, as above | The score itself |
| 2 | What type of person do you think would benefit most from [product]? | Open text | Your ideal-customer description, written by customers |
| 3 | What is the main benefit you get from [product]? | Open text | Positioning language and the value to protect |
| 4 | How can we improve [product] for you? | Open text | The roadmap input, read separately per answer group |
| 5 | What would you use instead if [product] disappeared tomorrow? | Open text | Real competitive set, which is rarely the one you assume |
| 6 | Which best describes your role / company size? | Closed list you define | Segmentation, which the whole analysis depends on |
Four practical rules for the wording:
- Ask question 1 first, alone on its screen. If a respondent reads “how can we improve this” before answering, you have primed them toward dissatisfaction.
- Do not reword the core question. “How disappointed would you be” presupposes disappointment and pushes the distribution. The value of this item is that thousands of teams have asked it identically; changing it discards the comparison.
- Keep question 6 closed and pre-defined. Free-text roles cannot be segmented without hand-coding, and hand-coding after you have seen the scores is how convenient segments get invented.
- Do not attach an incentive. A prize draw recruits people motivated by the prize, which is the one population whose feelings about your product are irrelevant.
Question 5 is the one most templates omit and the one that most often changes a roadmap. “A spreadsheet” and “nothing, I’d go back to doing it manually” are very different answers from naming a competitor, and only the first two mean you are competing against inertia rather than against a company.
Who qualifies to answer, and who quietly ruins the number
The score is only meaningful for people who have had a real chance to depend on the product. The qualification standard in common use, and the one Superhuman applied when it ran this survey, is straightforward: the respondent has experienced the core functionality, has used the product at least twice, and has used it within the last two weeks.
Exclude, without exception: signups who never activated, users still inside their first session, anyone on an internal or investor account, and — for a paid product — free-tier users you have no intention of ever charging. Each of these dilutes the numerator with people whose opinion cannot predict anything about willingness to keep paying.
Then decide what to do with the fourth answer option, and write the decision down before you send anything, because it moves the number more than almost any product change you could ship in the same quarter. Screening lapsed users out at the invitation stage is legitimate and normal — it makes the result a statement about active users, which is what the test is for. Inviting them and then deciding what to do with their answers after you have seen the score is not, and it is the same manoeuvre as picking your audience to fit the number.
The same 70 fans, three different scores. Suppose 70 people answer “very disappointed”. What you report depends entirely on who you invited and who you count:
| Audience you surveyed | Responses | “Very disappointed” | Reported score |
|---|---|---|---|
| Active users only (≥2 sessions in 14 days), lapsed users excluded from the denominator | 190 | 70 | 36.8% |
| Everyone who ever signed up, “I no longer use it” removed from the denominator | 250 | 70 | 28.0% |
| Everyone who ever signed up, all 500 responses counted | 500 | 70 | 14.0% |
Nothing about the product differs across those three rows. The spread is 22.8 percentage points, which is larger than the gap between a passing and a failing score. This is why comparing your number to a benchmark, or to your own number from last quarter, is meaningless unless the audience definition is identical — and it is why the audience definition belongs in the same document as the result, every single time.
How many responses the 40% test actually needs
This is where the standard advice fails hardest. The commonly quoted minimum is 30 to 100 responses. That is enough to produce a percentage. It is not remotely enough to tell you which side of 40% you are on.
A survey score is a proportion estimated from a sample, so it carries a confidence interval, and the width of that interval is what decides whether you have learned anything. Two different questions get asked of it, and they have different answers:
- “I have a score. Is it distinguishable from 40%?” — the confirm column below.
- “I am about to run this. How many responses should I collect?” — the plan column, which is roughly double, because a sample sized only to confirm has about a coin-flip chance of actually landing clear of the line.
| Observed or expected score | Distance from 40% | To confirm a score you already have | To plan a run |
|---|---|---|---|
| 20% or 60% | 20 points | 24 | about 45 |
| 25% or 55% | 15 points | 41 | about 80 |
| 30% or 50% | 10 points | 93 | about 185 |
| 32% or 48% | 8 points | 145 | about 290 |
| 35% or 45% | 5 points | 369 | about 750 |
| 38% or 42% | 2 points | 2,305 | about 4,700 |
Method. Both columns computed for this article. The confirm column is the smallest sample at which a 95% Wilson score interval around the observed score no longer contains 0.40. Because the Wilson interval is the inversion of the score test, that reduces to a closed form — n = 1.96² × 0.4 × 0.6 ÷ (distance)² — which depends only on how far the score sits from 40%, never on which side. The plan column is the sample needed for 80% power at a two-sided 5% significance level, and is mildly asymmetric because the variance of the true proportion differs above and below the threshold; the figures are rounded. Cross-check against published work: MeasuringU, working the same problem, reports a margin of error of ±13 points at n=50 around a 40% estimate — a plausible range of roughly 27% to 53% — against ±3 points at n=1,000. Our method agrees with both to within half a point.
The practical shape of this is one rule and one warning.
The rule: what matters is not your score but its distance from 40%, and the cost of resolving it rises with the square of how close you are. Ten points away, ninety-odd responses settle a score you already hold. Five points away, four times as many. Two points away, you need a sample most early-stage products do not have users to fill — which is the arithmetic telling you to stop trying to resolve it and act on other evidence instead.
The warning: the grey zone and the sample-size problem are the same phenomenon. Scores of 25-39% are the scores that cannot be resolved at typical sample sizes, precisely because they sit closest to the line. A team that surveys 60 active users, gets 35%, and concludes it has failed the test has concluded nothing — at n=60 an observed 35% has a 95% interval running from 24% to 48%, which contains both comfortable failure and comfortable success.
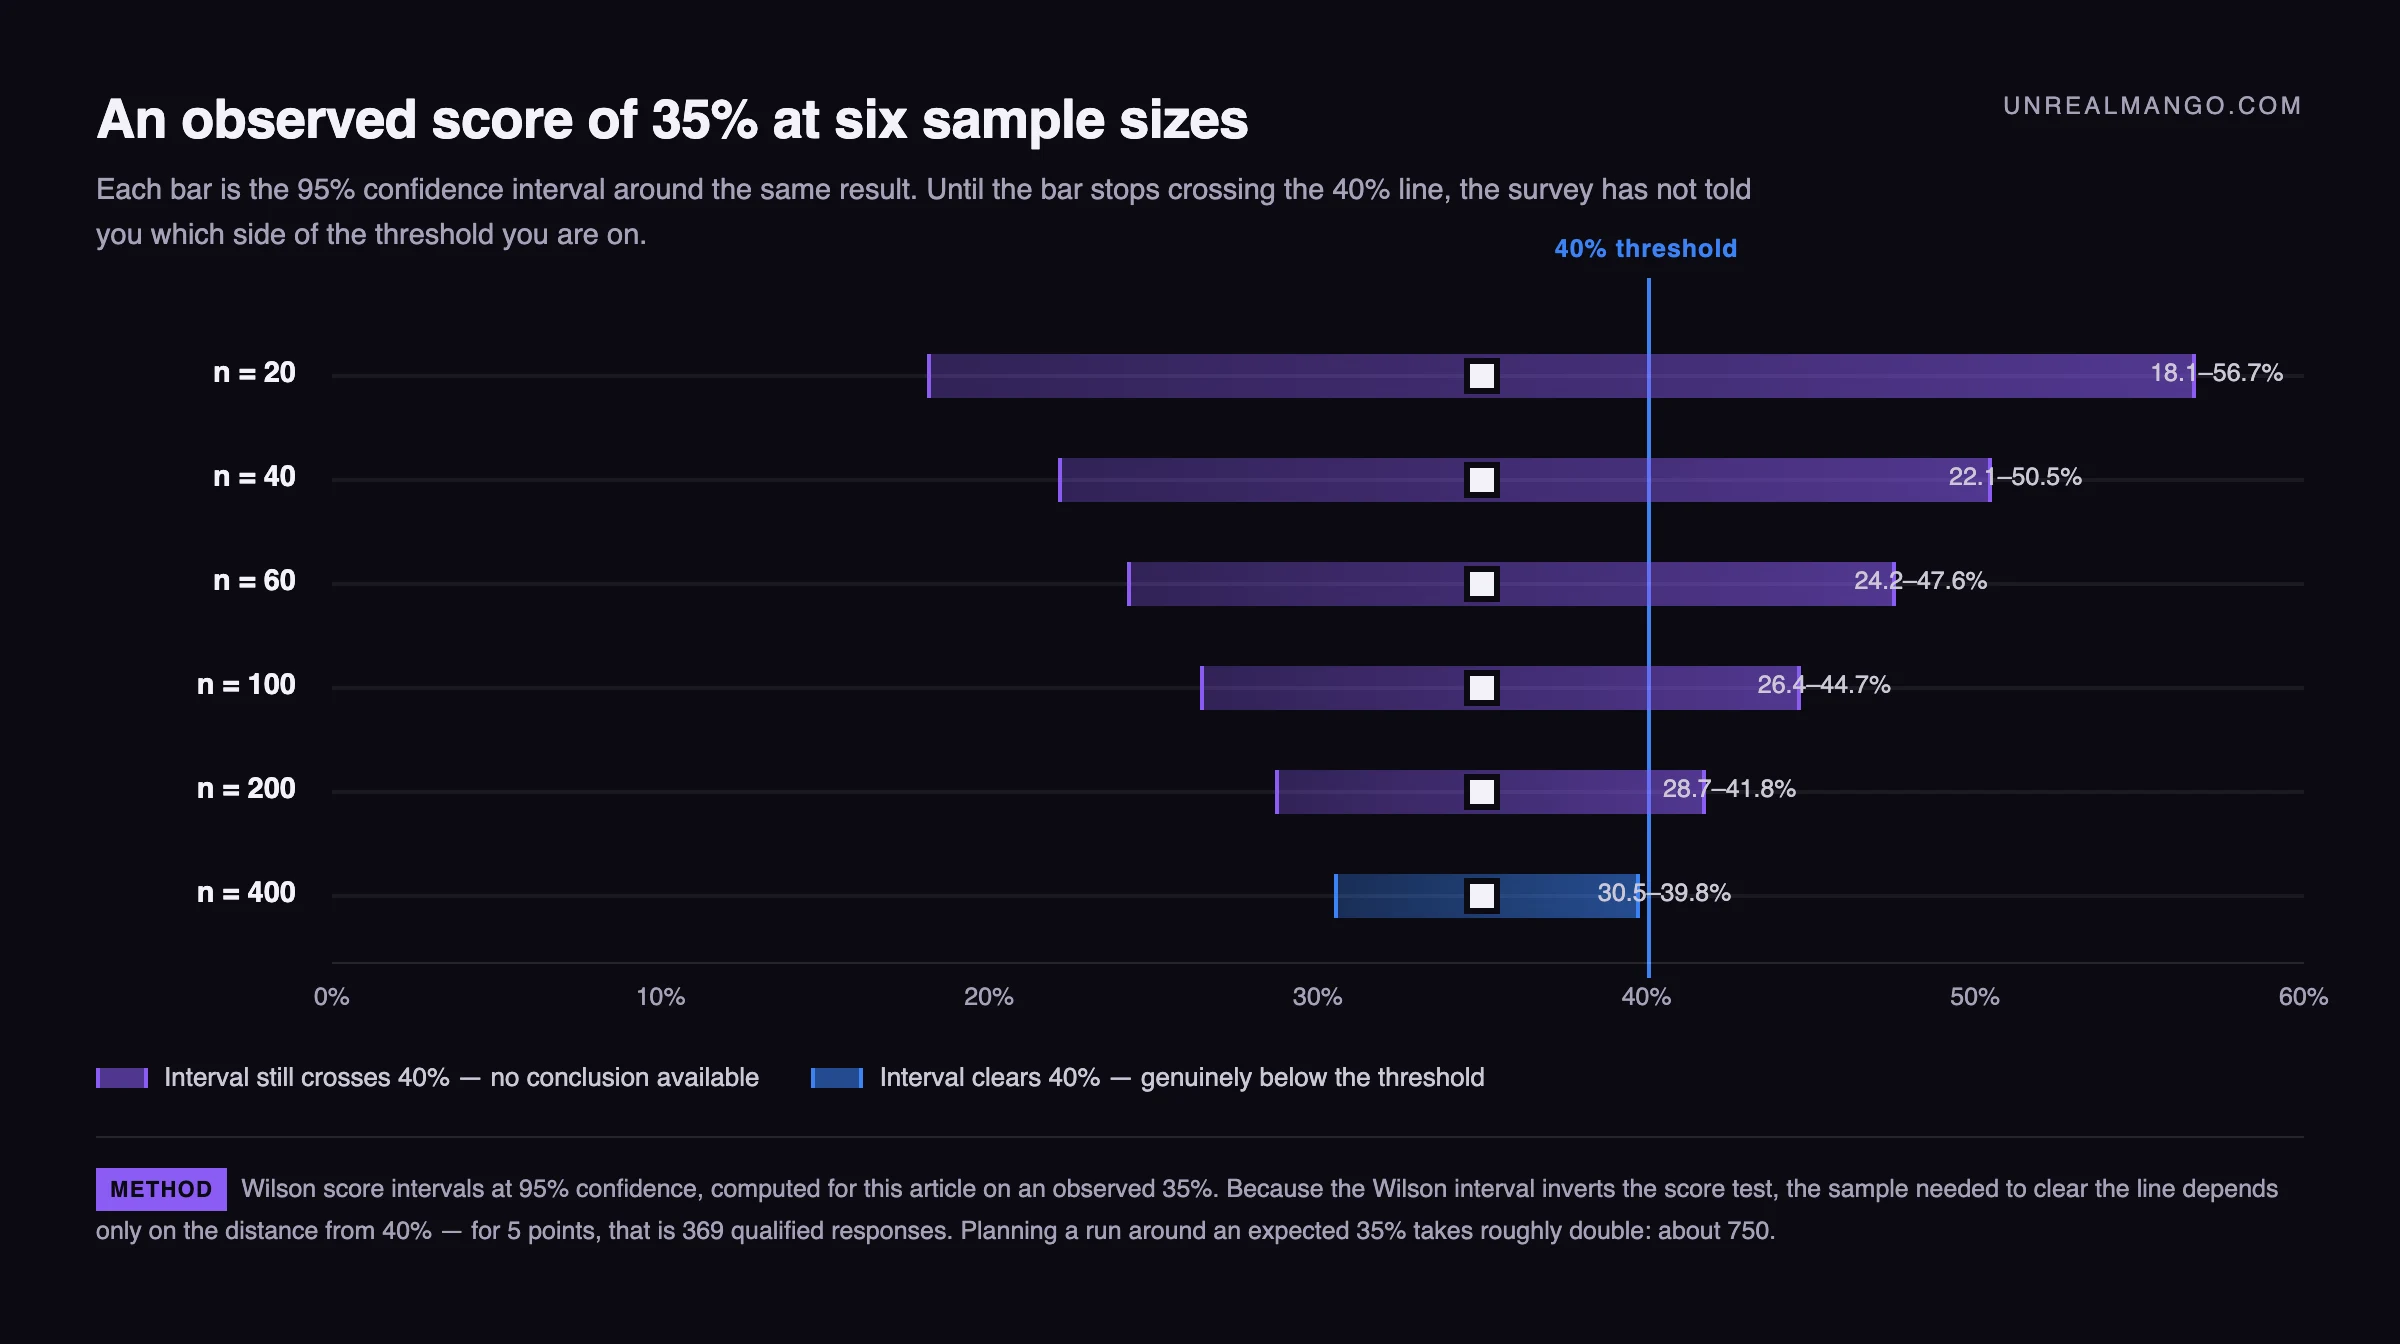
One more piece of arithmetic worth doing before you start. Planning a run around an expected 35% means collecting about 750 qualified responses. If your in-app survey converts at 20%, that is roughly 3,750 qualified users you need to put it in front of; at a 10% response rate, 7,500. For many early products that population simply does not exist yet — which is itself a finding, and points you toward the interview track in the next section rather than toward a bigger survey.
Reading the very disappointed segment instead of the whole list
The single number is a summary, and the summary is usually the least useful output of the survey. The reason is that a product rarely fails uniformly; it is a must-have for a coherent group and a nice-to-have for everyone else, and the aggregate score averages those two populations into a figure that describes neither.
Superhuman’s run of this survey, documented by First Round Review, is the clearest published example. The company surveyed 100 to 200 users who had used the product at least twice in the previous fortnight. Its initial score in the summer of 2017 was 22% — well under the threshold, and far enough below it that a sample that size settles the question. Rather than treating that as a verdict on the product, the team split respondents by who they were, discarded the groups that were never going to love the product, and recalculated on the remaining population. The score on that segment was 33%. No code had changed.
Apply this article’s own arithmetic to that step and it comes out honest but narrower than it is usually retold. At n=200, an observed 33% has a 95% interval of 26.9% to 39.8%: still clearly under the threshold, so the segmentation did not manufacture a pass, it relocated a failure onto a population worth fixing it for. The final 58%, at the same sample size, has an interval of 51.1% to 64.6% and clears comfortably. Note also that the segmentation here was done after the first score was known, which is exactly the sequence the second rule below warns against — it works as a worked example because the segments were derived from who the customers were rather than from which cut scored best, and because the result was then confirmed by two further rounds of measurement.
They then read the free-text answers from the people who said somewhat disappointed, on the theory that this group is close enough to convert and specific enough to tell you what is missing, while the “not disappointed” group is mostly noise. They built a profile of the customer who did love the product — the high-expectation customer — and split the roadmap in half: 50% deepening what the fans already valued, 50% removing the specific barriers the near-misses had named. Within three quarters the score reached 58%.
Two rules keep this from becoming self-deception:
- Declare your segments before you look at the scores. Slicing repeatedly until a cut clears 40% will always eventually succeed, and means nothing. Define candidate segments from question 6 and from your own hypotheses first, then score them once. If you only think of a segment after seeing the numbers, treat it as a hypothesis for the next round, not as a result from this one.
- Check the segment is a business. A 60% score inside a segment representing 4% of a small addressable market is a well-fitting product for an audience too small to fund the company. That is a positioning decision, not a validation.
What to do at 25 to 39 percent, where most teams land
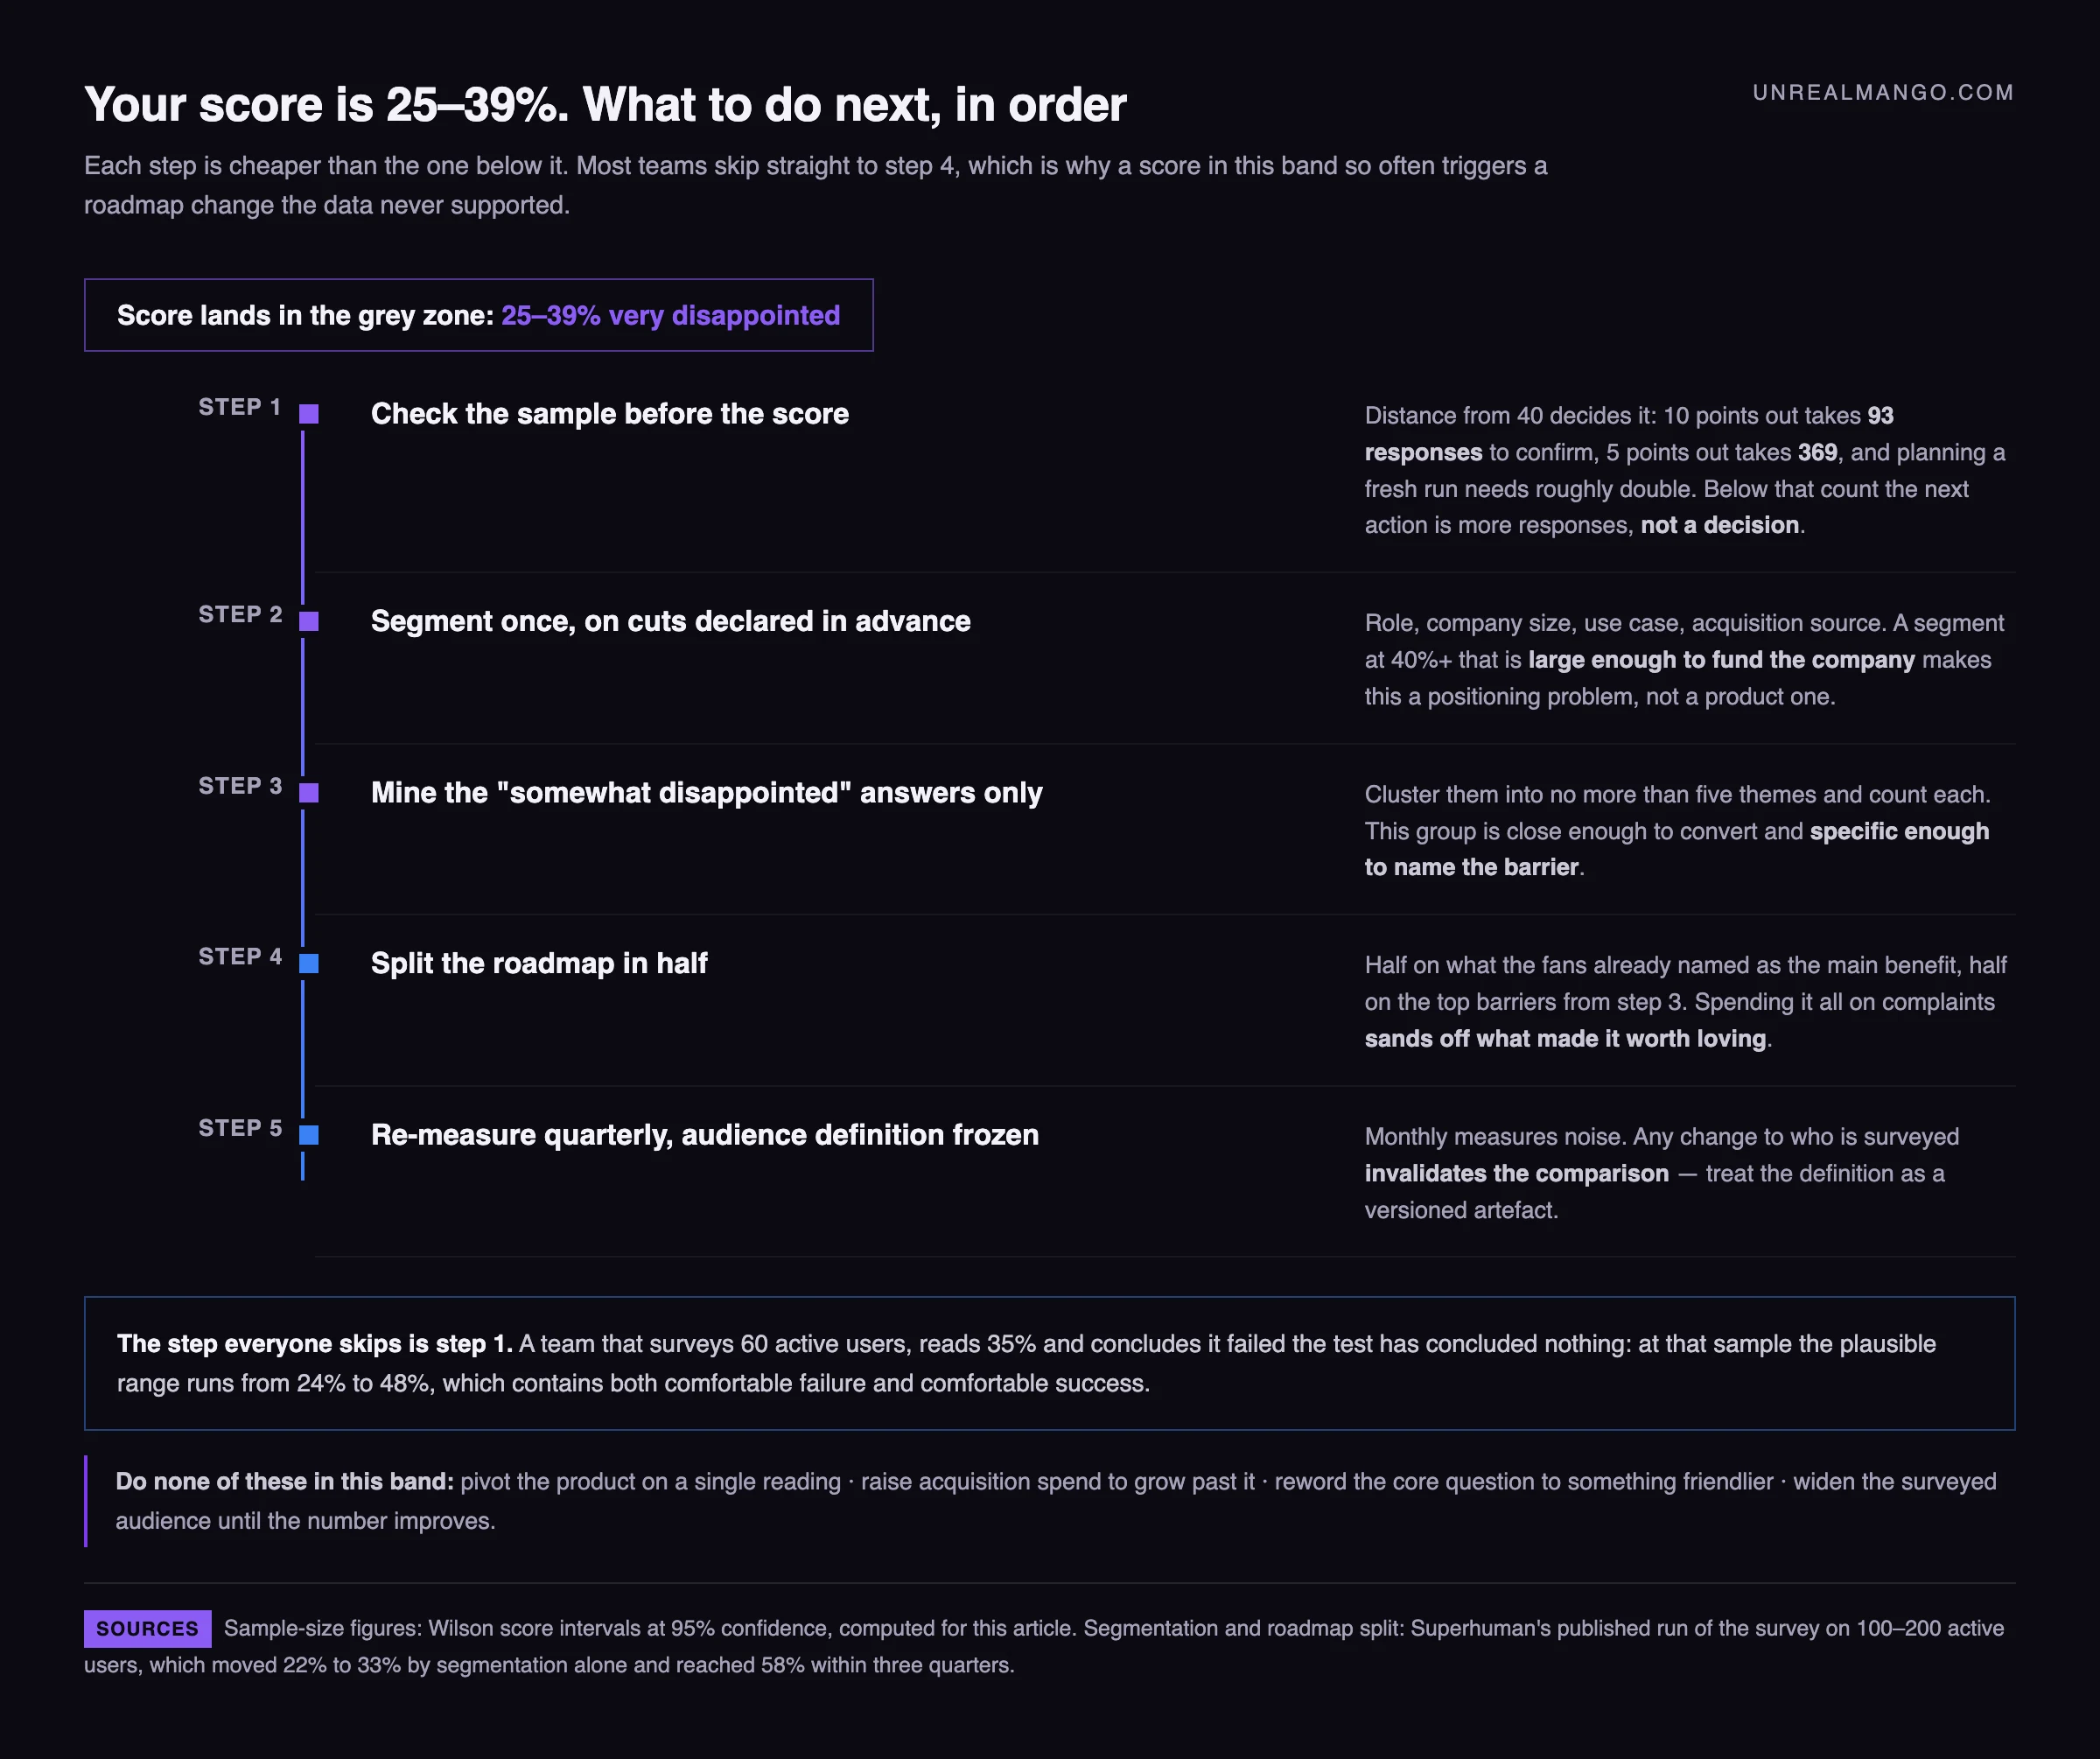
This band is where the survey is most often run and least often useful, because the published guidance effectively stops at “you don’t have product-market fit yet”. Here is the sequence that actually resolves it, in order — each step is cheap enough to do before the next.
Step 1 — Establish whether you have a result at all. Look up your score in the sample-size table above. If your response count is below the number in that row, you do not have a finding, you have a point estimate. The correct next action is more responses with the identical audience definition, not a decision. This single check disqualifies a large share of “we failed the test” conclusions.
Step 2 — Segment once, on pre-declared cuts. Score by role, by company size, by use case and by acquisition source. You are looking for a segment at or above 40% that is also large enough to matter. If one exists, your problem is targeting and positioning rather than product, and it should be solved in your messaging and your onboarding before it is solved in your roadmap.
Step 3 — Mine the “somewhat disappointed” answers, and only those. Read every question-4 response from that group. Cluster them into no more than five themes and count each. This produces a ranked list of the specific barriers standing between a near-miss and a fan — which is the highest-value output the survey generates, and the one most teams never extract because they stopped at the number.
Step 4 — Split the roadmap deliberately. Half the effort on what your “very disappointed” group already names as the main benefit in question 3, half on the top two or three barriers from step 3. The temptation is to spend everything on the barriers, because complaints are legible and praise is vague. Products that do this reliably sand off what made them worth loving.
Step 5 — Re-measure on a fixed cadence, with the audience definition frozen. Quarterly is enough for most products; monthly measures noise. Any change to who is surveyed invalidates the comparison, so treat the audience definition as a versioned artefact.
What not to do in this band, in order of how often it happens: pivot the product on a single reading; increase acquisition spend to “grow past it”, which reliably fills a leaking bucket faster; reword the question to something friendlier; or broaden the surveyed audience until the number improves. The last two produce a better score and no better product, which is the worst possible combination because it removes the pressure to fix anything.
Mapping the score onto the stage you are actually at
A survey score is one axis: how much a set of users values the product. It says nothing about whether demand is repeatable or whether you can serve it efficiently, and both of those decide whether the company works. The most useful published cross-check is First Round Capital’s Levels of PMF framework, drawn from First Round’s own portfolio experience — more than 500 investments across roughly twenty years — together with dozens of founder interviews.
| Nascent | Developing | Strong | Extreme | |
|---|---|---|---|---|
| Customers | 3-5 | 5-25 | 25-100 | 100+ |
| ARR | $0-500K | $500K-5M | $5-25M | $25M+ |
| Net revenue retention | — | 100%+ | 110%+ | 120%+ |
| Gross margin | — | 50%+ | 60-70%+ | 80%+ |
| CAC payback | — | — | Under 18 months | Under 12 months |
| Team size | Under 10 | Under 20 | 30-100 | 100+ |
Abridged: the source also tracks regretted churn and burn multiple across the same four levels.
Put next to the survey, this framework does two things.
It explains why a high score can be misleading early. At Nascent, with a handful of hand-held customers, a 55% score is close to guaranteed and close to meaningless — you have found a problem worth solving for five people, and the survey has no way to tell you whether the sixth is reachable. Notice that a Nascent-stage company also cannot reach the sample sizes in the previous section, which is a structural reason to treat the survey as a Developing-stage-and-later instrument.
It also explains why a mediocre score at a later stage is more alarming than founders treat it. If you have 40 customers, $8M in ARR and a survey score of 31%, the retention and margin rows are where the truth lives, and the survey is telling you that growth is currently being bought rather than pulled.
Five ways a product-market fit score gets inflated without anyone lying
Each of these is a defensible-sounding methodological choice that happens to move the number up. Together they can lift a score by more than twenty points, which is why the method note matters as much as the result.
- Prompting in-app to daily active users only. Convenient, and it surveys the people already most attached. The score describes your power users, not your market.
- Inviting your whole signup list, then dropping the lapsed answers from the denominator. Screening those users out before you invite them is fine and should be stated. Deciding to discard them once you have seen what they did to the number is the same choice made backwards, and it reliably moves the score up.
- Reminding people what the product does before asking. Any framing copy above question 1 is a nudge. Ask cold.
- Reporting a point estimate with no sample size next to it. “We’re at 38%” and “we’re at 38%, n=45” are different claims, and only the second one can be argued with.
- Changing the audience between runs and comparing anyway. Last quarter’s cohort was trial users, this quarter’s is paying customers, and the eleven-point improvement is entirely an artefact.
The fix for all five is a two-line preamble on every reported result: the exact audience definition, and the number of qualified responses. If those two lines are present, everything else is checkable — which is also what turns the survey from an opinion into a measurement.
What the score changes about how much you spend to grow
The reason this measurement earns its place in a marketing conversation rather than only a product one is the spending decision that hangs off it. Sean Ellis’s original argument was about sequence: below the threshold, money spent on acquisition mostly buys people who will confirm, at scale and at cost, that the product is not yet a must-have. Above it, the same money compounds because the users it brings stay.
That does not mean stop marketing at 33%. It means the shape of the spend should change. Below the threshold, the work that pays is the work that sharpens who you are for — positioning, segment-specific messaging, onboarding that gets a new user to the moment your fans described in question 3. Above it, volume starts to make sense. A survey score sitting in the grey zone is, more often than not, a positioning problem being read as a product problem: the product is a must-have for someone, and the marketing is addressed to everyone.
Two practical connections are worth making with data you already have. First, treat survey enthusiasm as a signal, not a qualified demand — the same distinction that separates a marketing qualified lead from a sales qualified one, where an inference from behaviour and a verified problem-plus-budget are routinely confused. Second, if you are fundraising, the score belongs on the traction slide with its sample size and audience definition attached; an unqualified percentage in a deck is the kind of number that invites the wrong question at the wrong moment.
If the survey has told you that a specific segment loves the product and the rest of the market is indifferent, the next piece of work is narrowing everything the market sees to that segment. That is the job we do with early-stage companies — and it is the cheapest available response to a score in the thirties, because it costs no engineering time at all.
11 / Reader questions
Frequently asked questions
01What is a product-market fit survey?
A product-market fit survey asks active users one question: how would you feel if you could no longer use this product? The share who answer very disappointed is the score. Five short follow-up questions collect the reasons behind it, and the whole thing takes a user two or three minutes.
02What is the 40% rule for product-market fit?
The 40% rule says a product has product-market fit when at least 40% of qualified users would be very disappointed to lose it. Sean Ellis arrived at the figure after benchmarking close to a hundred startups: those below it struggled to grow, those above it usually did not. It is a heuristic drawn from practice, not a validated statistical threshold.
03What is a good product-market fit score?
Anything at or above 40% is conventionally treated as good, 25-39% as a signal that a real segment exists but the product is not yet a must-have for it, and under 25% as a sign the current audience is wrong. Read the number alongside your sample size. What matters is the distance from 40%: a score of 30% separates from the threshold at 93 responses, but a score of 35% needs 369, and 38% needs over 2,300.
04How many responses does a product-market fit survey need?
It depends entirely on how close your score sits to 40%, and the cost rises with the square of how close you are. To settle a score you have already seen: 10 points away from 40% takes 93 qualified responses, 5 points away takes 369, and 2 points away takes 2,305. To plan a run from scratch, roughly double those figures, because a sample sized only to confirm has about a coin-flip chance of actually landing clear of the line.
05What are the 4 stages of product-market fit?
First Round Capital's Levels of PMF framework names four: Nascent, Developing, Strong and Extreme. They are defined by customer count, revenue, retention and margin rather than by a survey score, running from 3-5 customers and under $500K ARR at Nascent to 100+ customers and $25M+ ARR at Extreme.
06Can you run a product-market fit survey before launch?
No. The question asks how someone would feel about losing a product they already use, so it needs users with real usage behind them. Asking pre-launch prospects produces a measure of stated interest, which historically correlates poorly with behaviour. Before launch, run interviews and demand tests instead.
07Is a product-market fit survey the same as NPS?
No. Net Promoter Score asks about willingness to recommend, which is a social act influenced by reputation and timing. The product-market fit item asks about personal loss, which is closer to whether the product has become load-bearing in someone's work. The two frequently disagree, and the disagreement is informative rather than an error.