Published
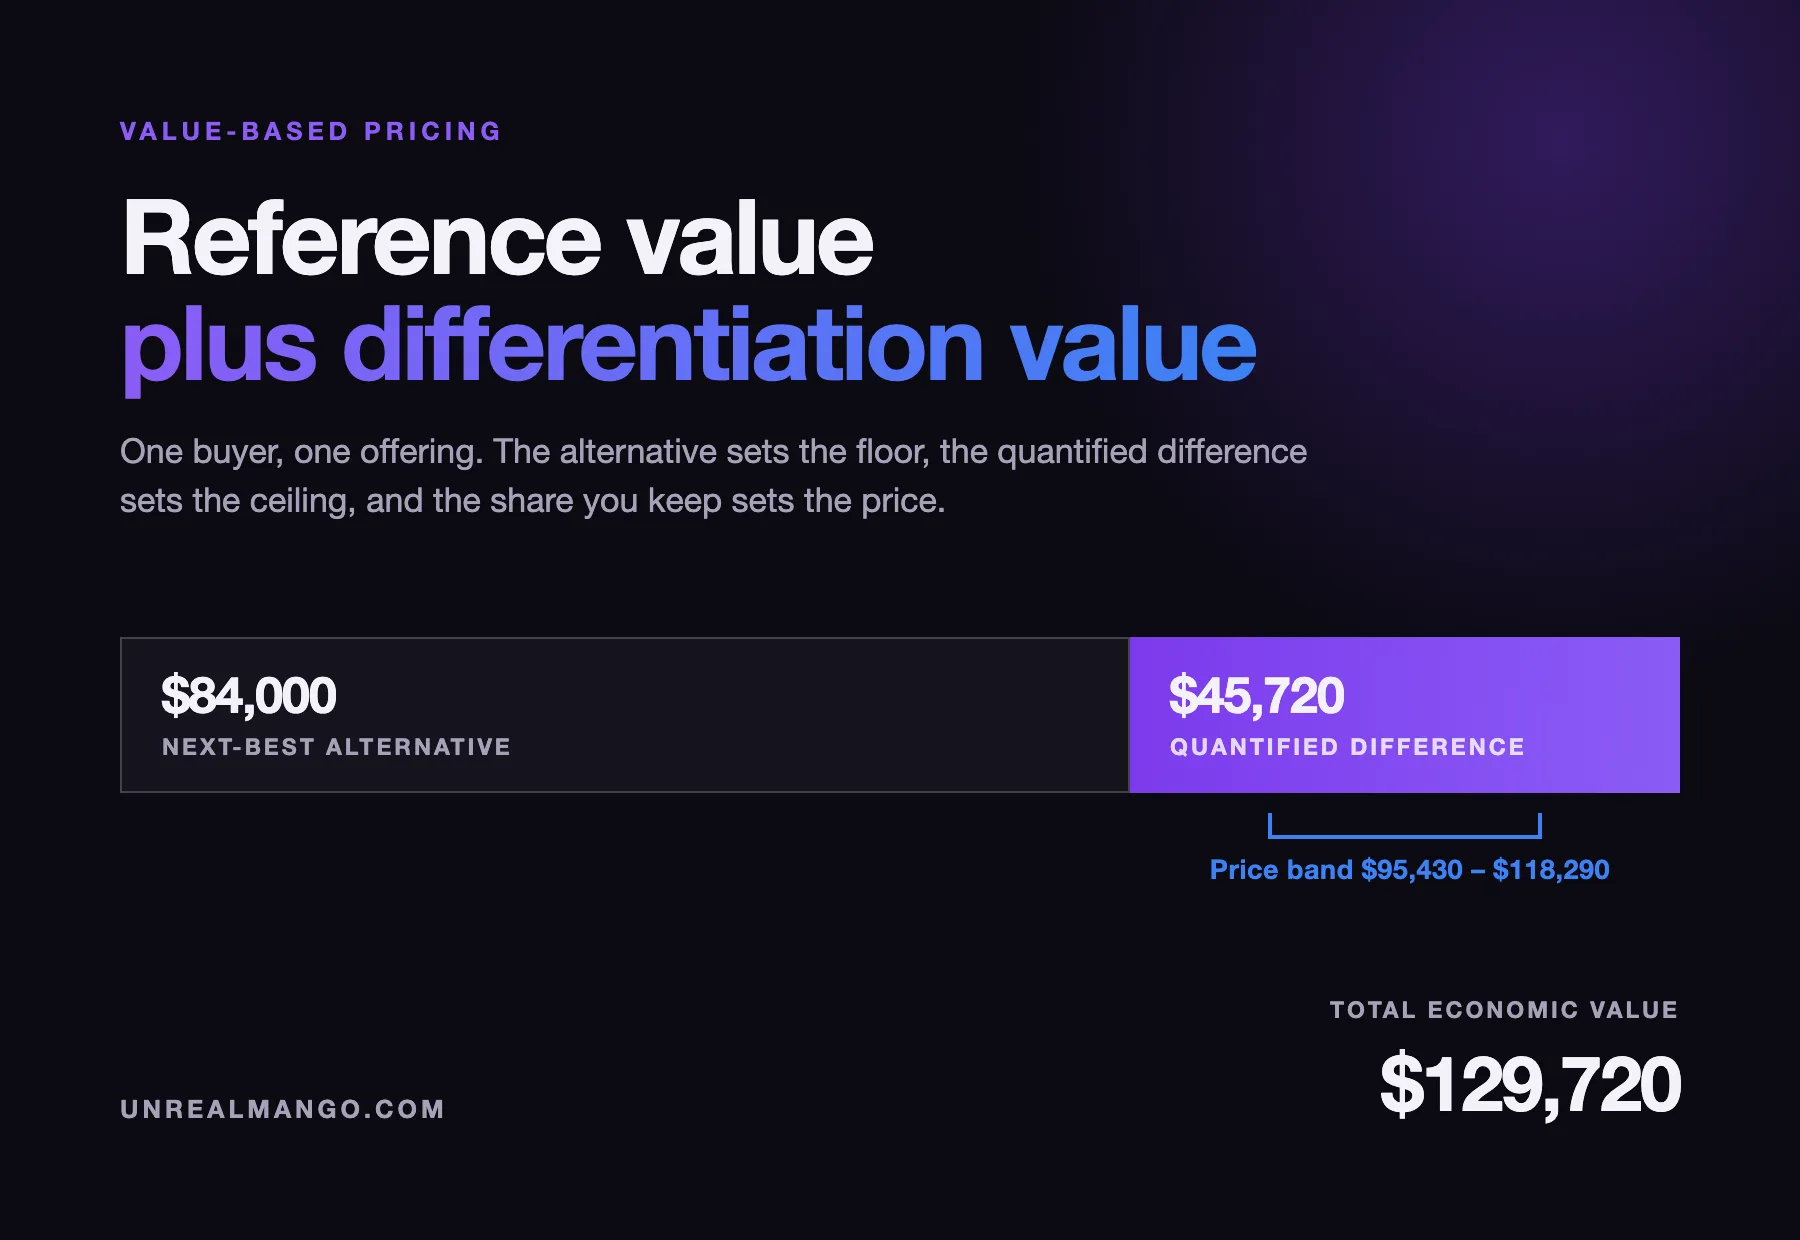
Value-based pricing sets a price from what the buyer’s alternative costs plus what your difference is worth to them, not from what the work costs you. The formula is reference value plus differentiation value. The hard part is not the formula — it is quantifying the difference and deciding how much of it to keep.
How this was checked. For this search in the United States on 23 August 2026, Google leads with an AI Overview and nine organic results: Harvard Business Review, Salesforce, Harvard Business School Online, Investopedia, Simon-Kucher, BillingPlatform, Wikipedia, Paddle and Corporate Finance Institute. Every one of them defines the method and compares it with cost-plus. None of them works the arithmetic through to a price, although Google’s own People Also Ask box asks for exactly that. The formula used below is the economic value estimation set out in Thomas Nagle and Georg Müller’s The Strategy and Tactics of Pricing; the five-step procedure built on it, and the worked example, are ours, with every input stated where it appears.
The example that runs through this article ends with one buyer, one offering and a price the calculation permits anywhere between $95,430 and $118,290 a year — a spread of 24% between keeping a quarter of the value you created and keeping three quarters. Both ends are defensible on the framework alone. A second test, later in this article, cuts the top off that band, and no page on this search applies it.
The decision is worth the work, because price moves profit faster than cost does. In the Harvard Business Review article that still anchors this argument, Michael Marn and Robert Rosiello calculated that on a composite built from the average economics of 2,463 companies in the Compustat aggregate, a 1% improvement in price produced an 11.1% improvement in operating profit, against 7.8% for a 1% cut in variable cost and 3.3% for 1% more volume. That comparison holds volume constant, which is exactly the assumption the section on migrating a price list stops taking for granted.
The calculation: reference value plus differentiation value
The definition is short. A product’s total economic value is the price of the buyer’s next-best competitive alternative — the reference value — plus the worth of whatever differentiates your offering from that alternative, which is the differentiation value. Negative differentiators are subtracted, not ignored.
Total economic value = reference value + differentiation value
That formula is Nagle and Müller’s. The five steps below are our way of operationalising it, not a procedure quoted from the book:
- Name the buyer’s next-best alternative and its price. Not the market average, and not your closest competitor by size. The specific thing this buyer would do instead — including doing it in-house, and including doing nothing.
- List the value drivers on which your offering differs from that alternative, in both directions.
- Put money on each driver, using the buyer’s own figures: their deal size, their close rate, their hourly cost, their downtime.
- Net the drivers into a single differentiation value.
- Add it to the reference value. That total is a ceiling, not a price. Charge all of it and the buyer has no reason to move.
Step three is where the method actually lives, and it is why the influence numbers look the way they do. A review of close to two dozen empirical studies of pricing practice across the United States, Europe and Asia, summarised by Andreas Hinterhuber in the Journal of Business Strategy in 2008, put the average influence of competition-based pricing at 44%, cost-based at 37% and customer value-based at 17%. The obstacles he catalogued are not conceptual disagreement with the method. They are the practical difficulty of assessing value, communicating it, segmenting the market and getting a sales force to hold the line.
A worked example: pricing a service against an in-house hire
A firm sells a demand-generation retainer to a mid-sized B2B services company. The buyer’s realistic alternative is hiring one marketing generalist.
Reference value. That hire is fully loaded at $84,000 a year — salary, payroll costs, equipment, a share of overhead.
The comparison window is twelve months from the decision, and every driver below is measured inside it. Stating the window is not pedantry: a driver that pays once and a driver that pays monthly behave differently, and the article that leaves the window implicit is the article whose second year does not add up.
Value drivers, priced with the buyer’s own numbers: pipeline running at 8 qualified opportunities a month, a 25% close rate and $6,000 of gross profit per won deal.
| Value driver | Direction | How it was quantified | Value in the window |
|---|---|---|---|
| Starts 2 months sooner than a hire-and-ramp cycle | + | 8 opportunities × 25% × $6,000 = $12,000 a month of gross profit, recovered for 2 months | $24,000 |
| Close rate moves from 25% to 30% across all 12 months | + | 0.4 extra deals a month × $6,000 × 12 | $28,800 |
| Software stack included rather than bought separately | + | $450 a month × 12 | $5,400 |
| No one on site: 2 hours a week of founder coordination | − | 2 × 52 × $120 an hour, against an assumed zero for an in-house hire | −$12,480 |
| Differentiation value | $45,720 |
Two of those rows need their assumptions on the record, because both are places where a value model quietly flatters itself.
The first two drivers are a decomposition, not two independent effects: the earlier start is valued at the baseline 25% close rate, and the rate lift is then applied across all twelve months, including the two recovered ones. Valuing the recovered months at 30% and applying the lift for twelve would count the same improvement twice. As a check, the direct calculation agrees: twelve months at 30% is $172,800 of gross profit, ten months at 25% is $120,000, and the difference is $52,800 — exactly $24,000 plus $28,800.
The close-rate lift is the one input that is not the buyer’s number. Pipeline volume, close rate, deal profit, software cost and the founder’s hourly cost are all figures the buyer can state today; five points of extra conversion is the seller’s forecast, and it carries $28,800 of the $58,200 of positive value. A forecast that large has to be defended rather than asserted — with results from comparable accounts, or by putting part of the fee behind it — or the last section of this article applies to your own example.
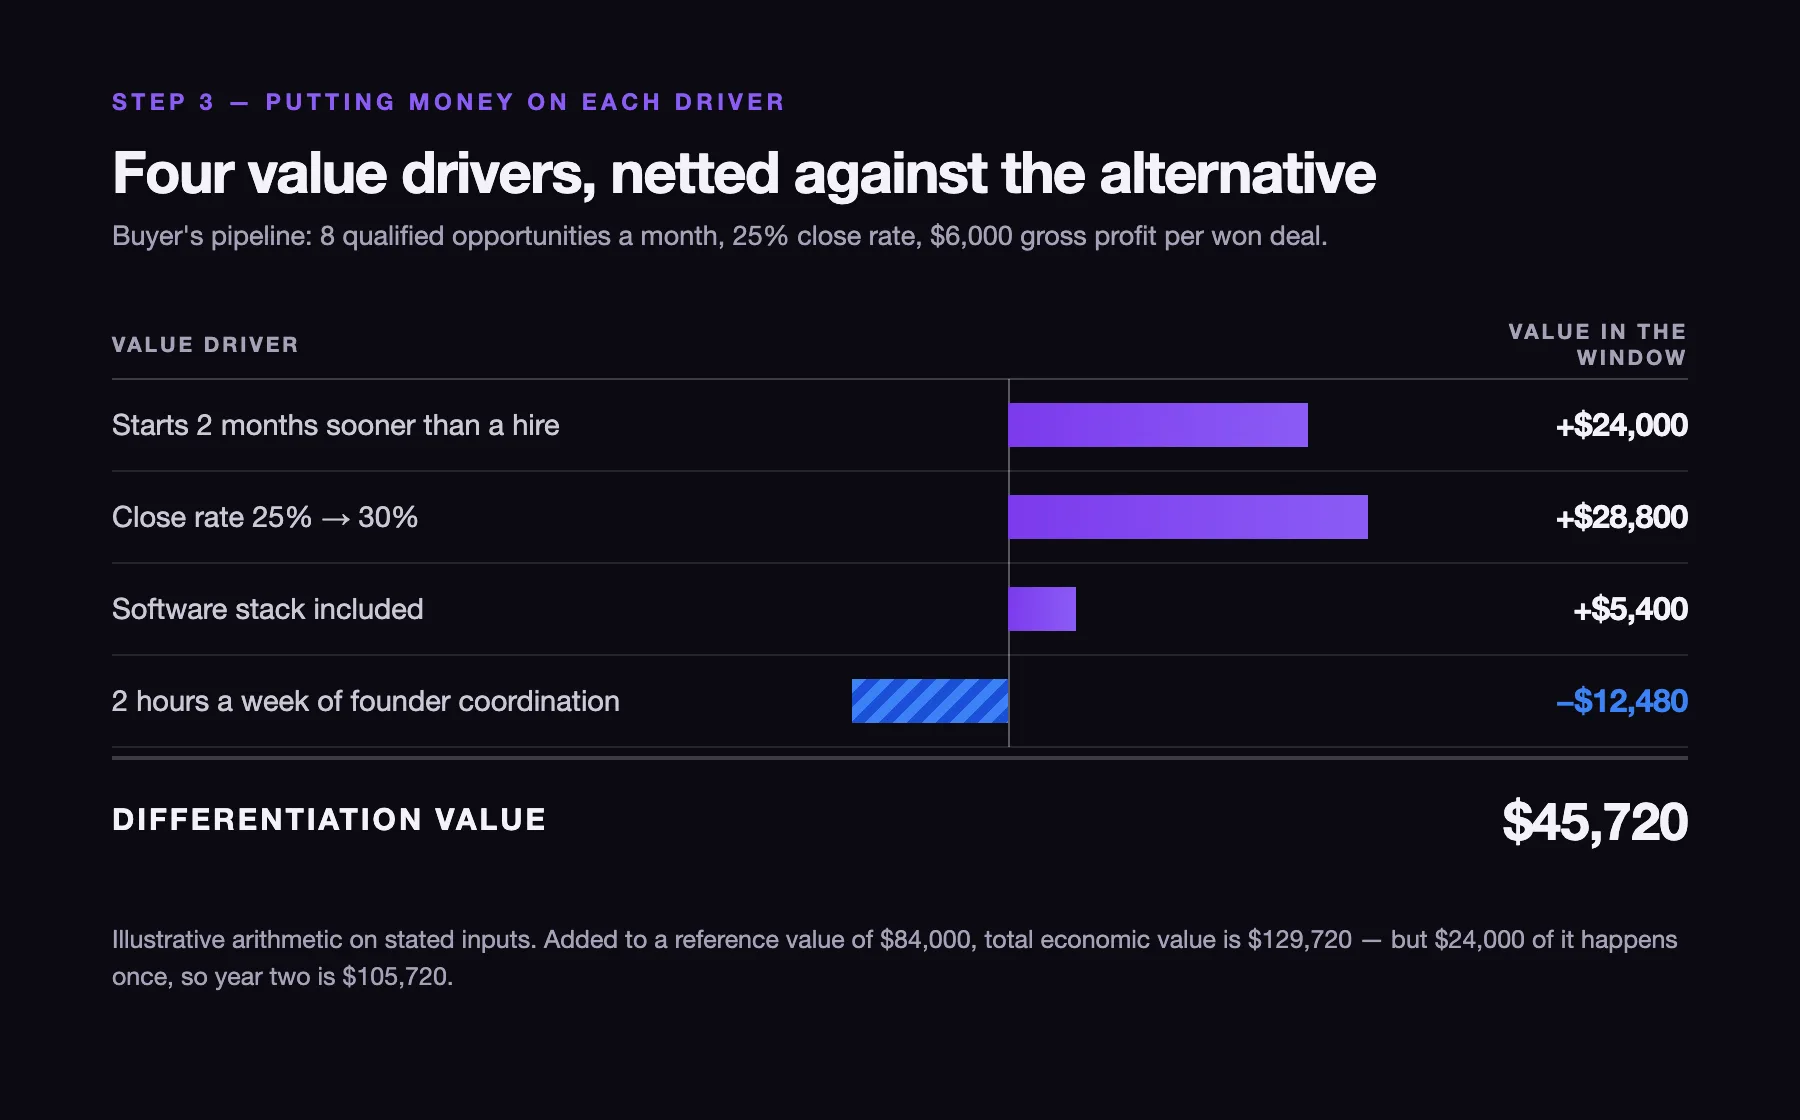
Illustrative arithmetic on stated inputs, not a client’s books and not a rate card.
Total economic value to this buyer in that first window is $84,000 + $45,720 = $129,720. The floor is $84,000, because below it the buyer is paying less than the alternative and you are competing on price with an employee. The ceiling is $129,720, because at that price the buyer keeps nothing for switching.
One caveat that the neat total hides. The first driver is a year-one effect: the two months of recovered pipeline happen once. Strip it out and economic value in year two is $84,000 + $21,720 = $105,720. That is the number a renewal has to clear, and it is lower than several of the prices in the next section.
How much of the differentiation value you keep
Nothing in the economic-value calculation tells you where in the band to price. That share is the commercial decision, and the rate at which it repays the buyer is fixed by the share alone — the absolute amount they keep still scales with the size of the differentiation value.
| Share of differentiation value kept | Annual price | Buyer’s extra spend vs the alternative | What the buyer keeps | Buyer’s return on the extra spend |
|---|---|---|---|---|
| 25% | $95,430 | $11,430 | $34,290 | 3.0× |
| 40% | $102,288 | $18,288 | $27,432 | 1.5× |
| 50% | $106,860 | $22,860 | $22,860 | 1.0× |
| 60% | $111,432 | $27,432 | $18,288 | 0.67× |
| 75% | $118,290 | $34,290 | $11,430 | 0.33× |
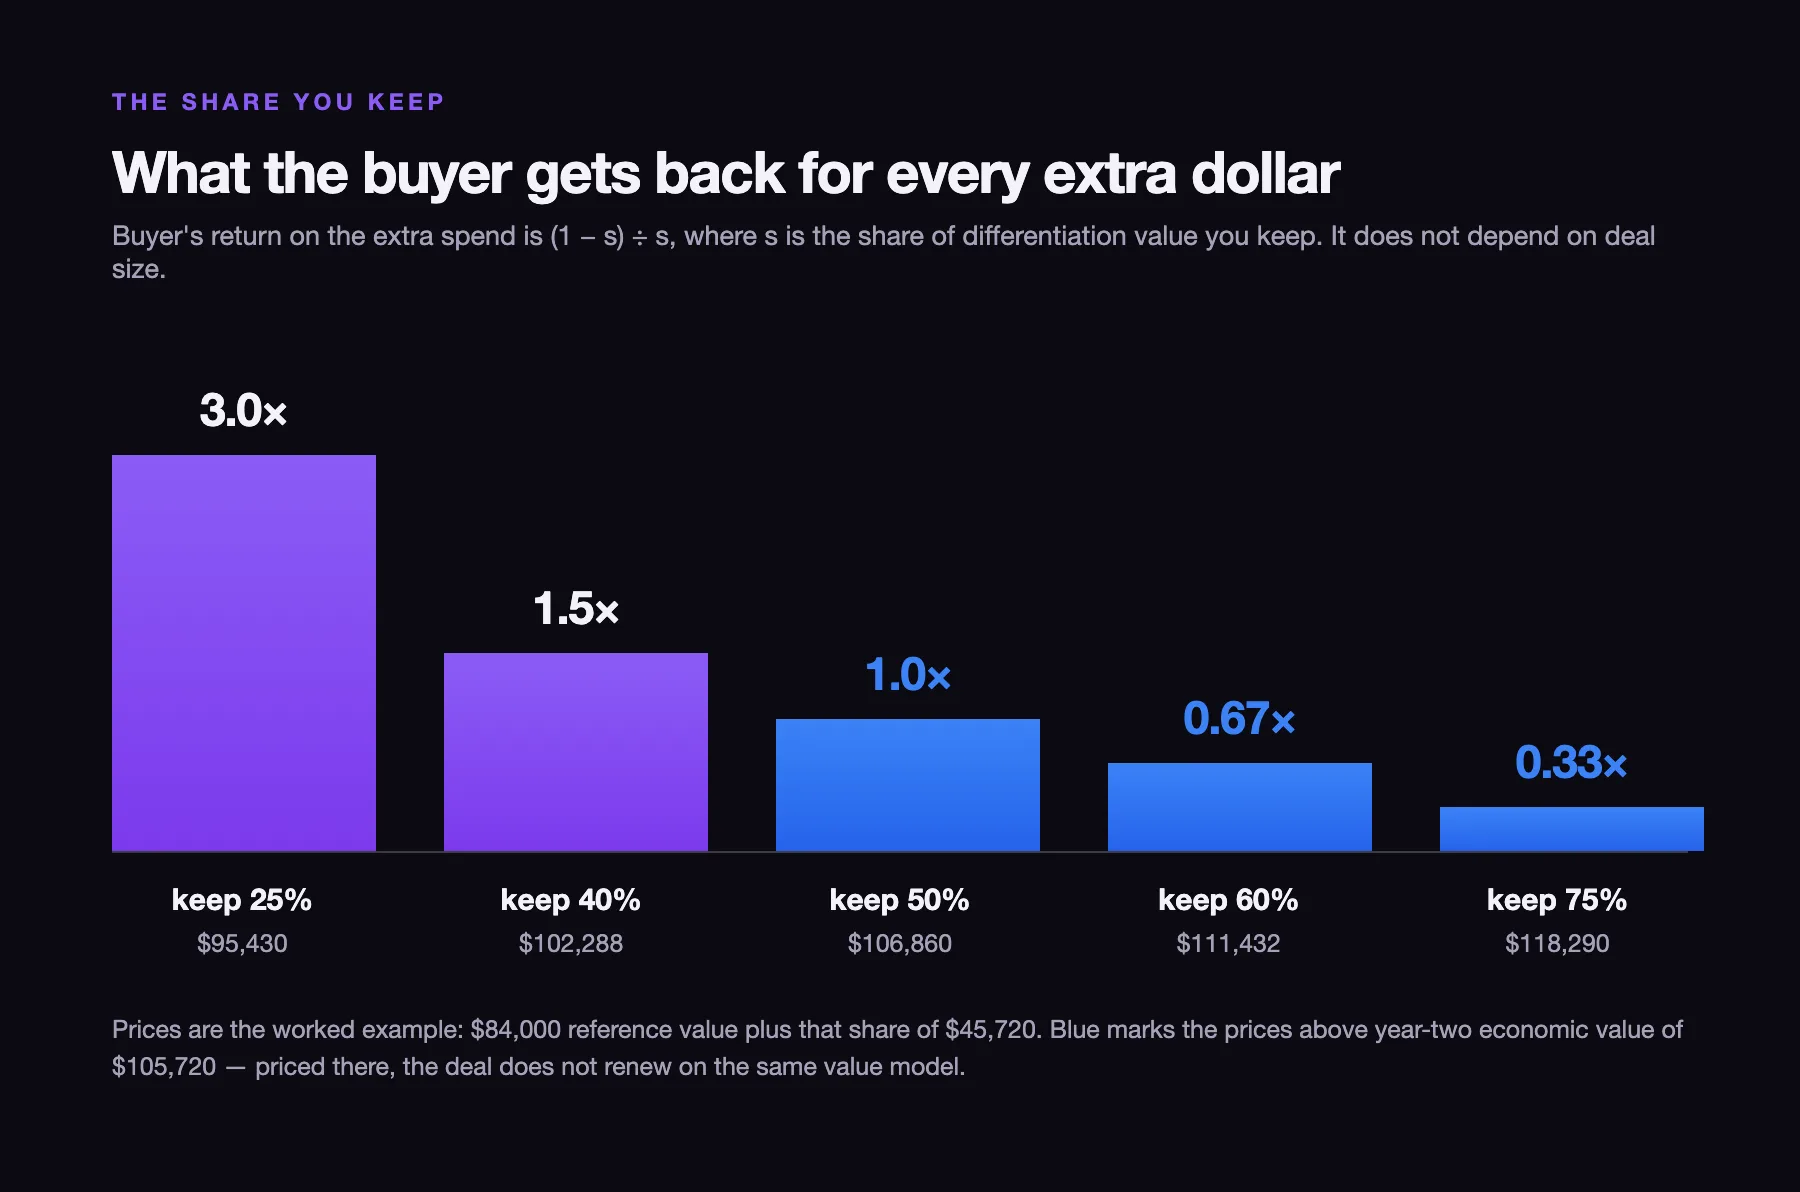
Arithmetic on the worked example above. The last column is not specific to it: the buyer’s return on the extra spend is (1 − s) ÷ s, where s is the share you keep, so it is the same at any deal size.
That identity is the useful part. Keep half and you are asking the buyer to spend a dollar to get a dollar back, which is a hard case to make against the comfort of an employee they can see. Keep a quarter and the same buyer gets three dollars for one, which is an easy meeting. The choice is not a moral question about greed; it is a decision about how much switching incentive the sale needs.
Then apply the year-two figure, which is the test the search results skip. Economic value in year two was $105,720. Price at 50% and the renewal conversation starts with the buyer $1,140 above their own value ceiling — the deal was priced on a benefit that does not repeat. The exact break point is a capture share of 47.5%, because that is the share of $45,720 that equals the $21,720 of value that survives into year two. Pricing at 25% or 40% clears it. Anything from 50% upwards does not, unless new drivers replace the one that expired — which is a real option, and a better renewal conversation than a discount.
Value-based pricing vs cost-plus and competition-based pricing
Every page on this search carries this comparison, so the table below adds the column they leave out: what each method fails at.
| Cost-plus | Competition-based | Value-based | |
|---|---|---|---|
| Starting point | Your cost | The going rate | The buyer’s alternative |
| What you must know | Your unit economics | Competitors’ published prices | The buyer’s outcomes and options |
| What moves the price | Your costs | Rivals’ moves | The buyer’s situation |
| Average influence in practice | 37% | 44% | 17% |
| Typical failure | Prices a differentiated offer like a commodity; efficiency gains are handed to the buyer automatically | Follows the least disciplined competitor down | Estimates get optimistic, and the sales force discounts anyway |
Influence figures from Hinterhuber’s 2008 review of close to two dozen pricing-practice studies.
The cost-plus failure is worth being concrete about, because it is silent. If your costs fall — better tooling, a better process, more experience — cost-plus passes the entire saving to the buyer without anyone deciding to. That is the mechanism by which a business gets more efficient every year and no more profitable.
Where value-based pricing sits among the seven pricing strategies
Search for pricing strategy and you get a list, usually seven items long. Value-based pricing is one entry on it, and knowing which of the others you are actually competing against matters more than the count.
| Strategy | Price starts from | Fits |
|---|---|---|
| Value-based | Buyer’s alternative plus quantified difference | Differentiated products and services with measurable outcomes |
| Competition-based | The prevailing market rate | Crowded categories where offers are genuinely comparable |
| Cost-plus | Your cost plus a markup | Regulated work, tenders, distribution, commodity manufacturing |
| Price skimming | The most early adopters will pay, reduced over time | Launches with a novelty window and thin competition |
| Penetration | Deliberately below market to buy share, raised later | Network effects, subscriptions, high switching costs |
| Economy | The lowest price a low-cost operation can sustain | High volume, low touch, minimal service |
| Dynamic | Recalculated by demand, timing or segment | Travel, events, marketplaces, perishable inventory |
The lists disagree with each other, which is worth knowing before quoting one. Paddle’s version names those seven; Salesforce’s names five, dropping economy and dynamic. The disagreement is about category, not fact: economy and dynamic pricing are arguably tactics layered on one of the other five rather than separate ways of arriving at a number. No standards body settles it.
Finding willingness to pay without a research budget
The estimation step needs the buyer’s numbers, and for a business with tens of deals a year rather than tens of thousands, three routes cost almost nothing.
Ask, deal by deal. In the qualification call: what would you do if you did not buy this, what does that cost, and what would a measurable improvement in that number be worth to you. A handful of interviews across won and lost deals produces a usable driver list, because the drivers repeat long before the numbers do.
Van Westendorp’s price sensitivity meter, introduced by Peter van Westendorp in 1976, when the sample is larger. Four questions — at what price would this be a bargain, start to seem expensive, be too expensive, and be so cheap you would doubt the quality — plotted as cumulative curves whose intersections mark an acceptable band. Treat the output as a sanity check on a range rather than a price. The standard criticisms of direct-question pricing research apply to it: the intersections have no grounding in economic theory, the respondent is asked about price outside any competitive context, and one version of one offer gets tested.
Test on closed-lost. Deals you already lost on price are a free experiment. Re-quote a reconstructed value model to a handful of them and the answer arrives with no survey attached.
Conjoint analysis sits above all three: instead of asking about price directly it infers trade-offs from repeated choices between full offers, which is why it survives the criticism aimed at direct-question methods. It also needs a real sample and a designed study, so it belongs to a different budget than the three routes above.
Two segments, two economic values, one price list
If the calculation is done properly, two buyers of the identical offering will produce different economic values, because their alternatives and their deal sizes differ. Averaging them is the mistake: an average price overcharges the segment with the weak alternative and undercharges the one with the strong outcome, and loses both.
Three ways out, in ascending order of effort:
- Fence the offer. Build genuinely different versions — service level, response time, scope, seniority of who does the work — so buyers self-select. The fence has to be a real difference the buyer would name, not a feature flag.
- Price the unit of value, not the hours. Per outcome, per location, per seat, per unit of the thing the buyer counts. The price then tracks the buyer’s own value automatically as they grow.
- Quote deal by deal where volumes are low and each deal is worth the estimation work. This is the honest answer for most professional services, and it is why published rate cards in that market are so often ranges.
Charging different buyers different prices is the intended consequence of the method, not an abuse of it, and between businesses it is ordinary practice. What constrains it is jurisdictional rather than universal: in the United States the Robinson-Patman Act reaches price discrimination in goods, not services; in the European Union and the United Kingdom the equivalent rules bite mainly on firms that are already dominant in their market. Consumer-facing differential pricing is more constrained again, and varies by country. None of that is legal advice, and a price list built on this method is worth ten minutes of a lawyer’s time in your own jurisdiction.
Migrating an existing price list off cost-plus
Switching methods on a live book of customers is where most of the risk sits, and none of the pages on this search covers it.
Apply the new model to new business first, and to existing customers at renewal, one cohort at a time. Publish the value model rather than the increase: a buyer who is shown the alternative, the drivers and the arithmetic argues with the drivers, which is a conversation you can have. A buyer who is shown only a bigger number argues with the number.
Then plan the churn instead of hoping about it. If a price rises by x and a share y of customers leave, revenue holds when y is no more than x ÷ (1 + x).
| Price increase | Churn a revenue-neutral increase can absorb |
|---|---|
| 5% | 4.8% |
| 10% | 9.1% |
| 20% | 16.7% |
| 30% | 23.1% |
| 50% | 33.3% |
Arithmetic, not a benchmark. On gross profit the tolerable share is higher, because departing customers take their cost to serve with them.
Those ceilings are usually more forgiving than they feel in the room. A 20% increase that costs one customer in eight leaves revenue ahead — and in our experience the customers who leave over a value-model conversation tend to be the ones whose economic value was lowest to begin with, because a buyer with a weak alternative is the one for whom the arithmetic never worked.
Checking the new price against unit economics
A higher price is not automatically a better business, and there are two arithmetic checks worth running before the price list changes.
The first is lifetime value. Price is a term inside it, so a rise flows straight through — unless the same rise shortens retention, in which case the two effects fight and the direction is an empirical question rather than an obvious one. The mechanics of that calculation are in our guide to the customer lifetime value formula.
The second is acquisition payback. A price rise shortens the CAC payback period mechanically, because the denominator grows — but a value-based price usually comes with a longer sales cycle and more sales effort, which grows the numerator too. Run both sides before claiming the improvement.
Both checks are part of the same job as the pricing decision itself, which is why a price change belongs inside a marketing strategy rather than beside it. Positioning determines which alternative the buyer compares you with, and the reference value is the largest single term in the calculation.
When value-based pricing is the wrong method
The method has real preconditions, and pretending otherwise produces a value model that is theatre draped over a number chosen some other way.
- No measurable differentiation. If the buyer cannot tell the offerings apart on anything they can count, the differentiation value is genuinely near zero and the reference price is the price.
- The buyer cannot attribute the outcome to you. Value that cannot be traced to the work will not be paid for twice.
- The transaction is too small. Estimating economic value takes hours of a buyer’s time. Below some deal size that cost exceeds the price improvement it unlocks.
- Price is set by someone else. Tenders, regulated rates and marketplace mechanics leave no room for a value conversation regardless of the value.
- Your differentiation value is negative. It happens, and the calculation is doing its job when it says so. The answer is a lower price or a different offer, not a better slide.
11 / Reader questions
Frequently asked questions
01What is value-based pricing with an example?
Value-based pricing sets the price from what the offering is worth to the buyer rather than what it costs to produce. Example: a buyer's alternative is an in-house hire at $84,000 a year, and the measurable advantages of using a firm instead are worth $45,720 net of its drawbacks over the first twelve months, falling to $21,720 a year afterwards once the one-off head start is spent. Economic value to that buyer is $129,720 in year one, so the price sits between $84,000 and that ceiling — and below $105,720 if the deal has to renew.
02How do you calculate value-based pricing?
Add the price of the buyer's next-best alternative (the reference value) to the money value of everything that differentiates your offering from it, positive drivers minus negative ones (the differentiation value). That sum is the total economic value, and it is the ceiling. The price is the reference value plus the share of differentiation value you decide to keep, which is a commercial choice rather than a formula.
03What is the difference between value-based pricing and cost-plus pricing?
Cost-plus starts at your costs and adds a markup, so the buyer's situation never enters the calculation. Value-based pricing starts at the buyer's alternative and adds what your difference is worth to them, so your costs never set the price, only the floor below which the deal is not worth doing. On the same piece of work the two methods can land far apart, because one number tracks your costs and the other tracks the buyer's situation, and nothing forces them to move together.
04What are the 7 common pricing strategies?
The list most widely published names value-based, competition-based, cost-plus, price skimming, penetration, economy and dynamic pricing. Shorter lists of five drop economy and dynamic on the grounds that they are tactics applied on top of another strategy rather than separate ways of arriving at a price. There is no standards body here, so the count varies by publisher.
05How do you find out what a customer is willing to pay?
For a small number of high-value deals, ask what the alternative costs and what the difference is worth, deal by deal, rather than running a survey. Structured methods exist for larger samples: Van Westendorp's four-question price sensitivity meter, introduced in 1976, plots four cumulative curves to find an acceptable price band, and conjoint analysis infers trade-offs from repeated choices.
06Can you charge different customers different prices under value-based pricing?
Yes, and it is the normal consequence of the method, because the same offering has a different economic value to buyers whose alternatives and outcomes differ. Between businesses this is ordinary commercial practice; what limits it depends on where you trade, since the US Robinson-Patman Act reaches price discrimination in goods rather than services and the EU and UK rules bite mainly on dominant firms. Consumer-facing differential pricing is more constrained again, so take local advice.
07When does value-based pricing not work?
It fails when there is no measurable differentiation from the alternative, when the buyer cannot attribute the outcome to you, when the estimation work costs more than the transaction is worth, and when price is set by a tender or a regulator. In those cases the honest answer is competition-based or cost-plus pricing, not a value model dressed over one.