Published
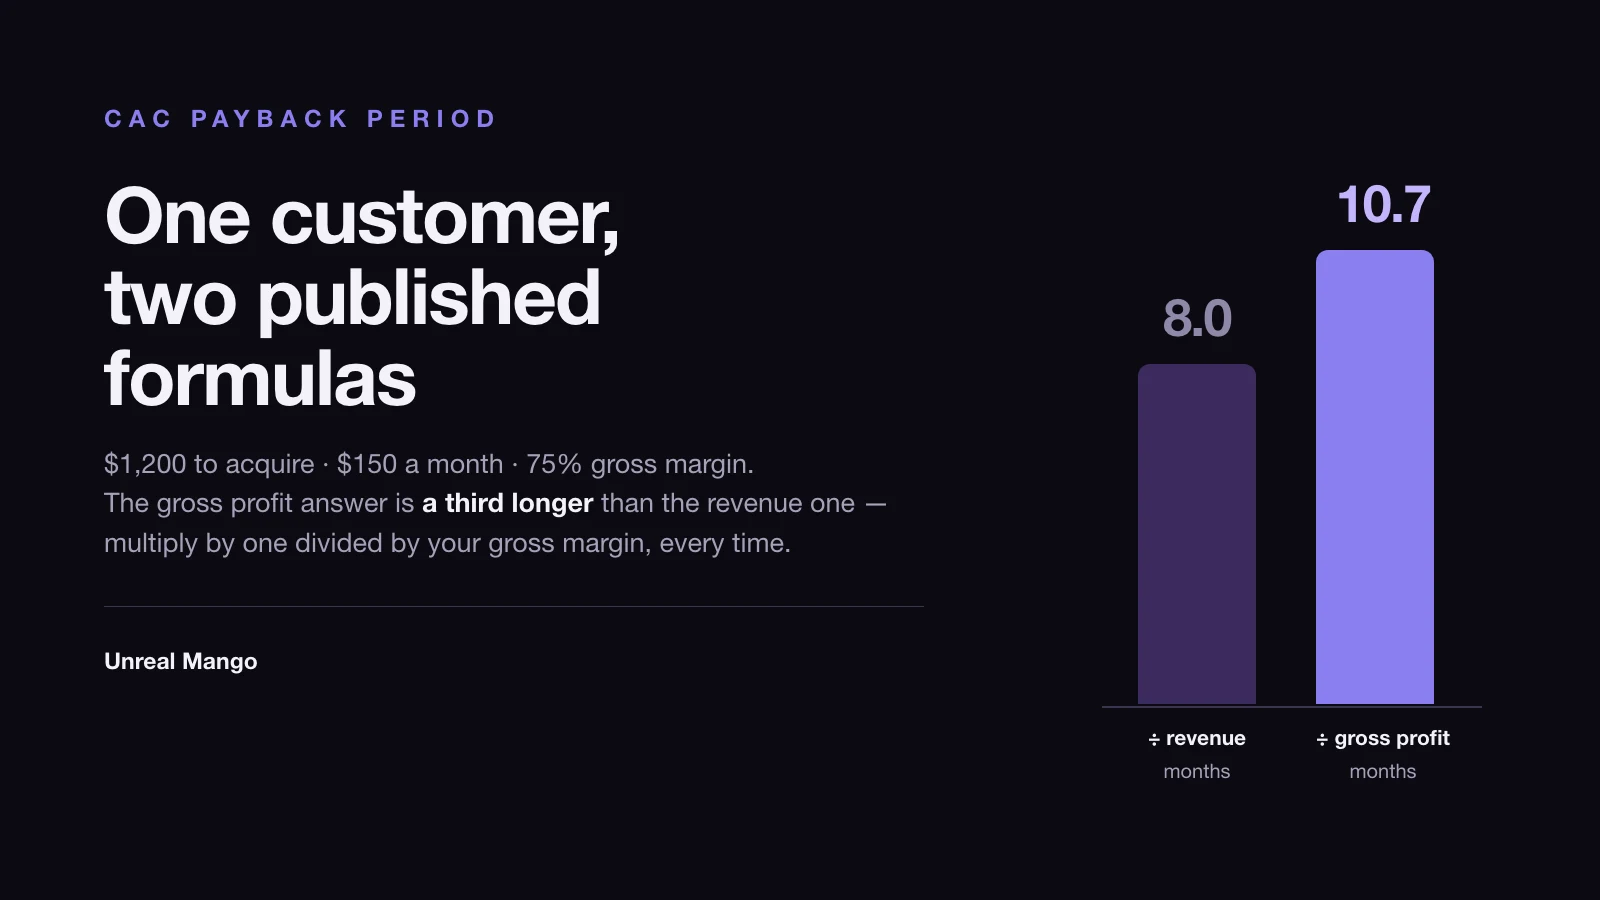
The CAC payback period is the number of months a customer’s gross profit takes to repay what it cost to acquire that customer. Divide acquisition cost by monthly revenue and you get one answer. Divide by monthly gross profit and you get an answer a third longer. Both versions are published as the formula, and the gap between them is not a rounding difference.
How this was checked. For this search in the United States on 18 August 2026, Google leads with an AI Overview and eight organic results: Wall Street Prep, The SaaS CFO, Corporate Finance Institute, Stripe, Chargebee, Growth Equity Interview Guide, Geckoboard and Maxio. Each page was read for two things — which denominator it divides by, and what months it calls healthy. The worked example below is illustrative, not a set of client books; its inputs are stated where they appear, and the benchmark figures carry their source and date.
One customer — $1,200 to acquire, $150 a month, 75% gross margin — pays back in 8.0 months, 10.7 months, 11.5 months or 11.9 months depending on which published formula you use, and on the day the first invoice clears if that customer is on annual prepay. The customer’s behaviour does not change across those five numbers. Only the formula and the billing terms do.
The formula, and the term that changes the answer by a third
The calculation is short:
CAC ÷ (MRR × gross margin) = payback period in months
The numerator is what it cost to land one customer — sales and marketing spend for a period, divided by the customers that period produced. Which costs belong inside it is an argument of its own, and one of its inputs is simply what a click costs on Google Ads in your category. For this article the acquisition cost is a given; the interesting part is underneath the line.
The denominator has to be gross profit, not revenue, because revenue that leaves again as hosting, support, onboarding and payment fees was never available to repay anything. And the correction it applies is not a nuance that varies case by case. It is a fixed multiplier: dividing by gross margin is the whole of it.
| Gross margin | The true answer is longer than the revenue answer by |
|---|---|
| 90% | 11% |
| 80% | 25% |
| 75% | 33% |
| 60% | 67% |
| 50% | 100% |
| 40% | 150% |
Arithmetic, not a benchmark: the margin-adjusted period equals the revenue-based period divided by gross margin, so the gap depends only on the margin.
That is worth stating plainly because it makes the error predictable. A company at a genuinely software-like 80% margin that quotes the revenue version is reporting four-fifths of its real payback. A company at 50% — services-heavy, infrastructure-heavy, or reselling something — is reporting half of it, and the further its margin sits from software, the worse the flattery gets.
Five payback numbers for one identical customer
Here is what the eight pages currently ranking for this query actually do. Seven of the eight put gross margin or cost-to-serve in the denominator. One divides by revenue alone, and one more presents a revenue-only “baseline” before offering the margin version as a refinement.
| Page (all eight organic results, 18 Aug 2026) | Denominator it divides by | What it calls a good result | Source it gives |
|---|---|---|---|
| Wall Street Prep | New MRR × gross margin | Under 12 months | none |
| The SaaS CFO | Gross profit dollars, adjusted for cost of capital | no figure named | — |
| Corporate Finance Institute | MRR × gross margin | Under 12 months | none |
| Stripe | Monthly revenue minus monthly cost to serve | 12 months or less | none |
| Chargebee | MRR alone | 5–12 healthy; 15 at seed; 28 at Series C | none |
| Growth Equity Interview Guide | New MRR × gross margin | 12, “industry standard” | none |
| Geckoboard | ARPA × gross margin | 12 or less; 5–7 high-performing | forEntrepreneurs, for the 12 |
| Maxio | Both variants, revenue version first | 9–14 profitable; 2–9 best | none |
Run one customer through those denominators and the spread is not academic. Take $1,200 of acquisition cost, $150 of monthly recurring revenue and a 75% gross margin — $112.50 of gross profit a month.
| Method | Calculation | Months |
|---|---|---|
| Revenue denominator | $1,200 ÷ $150 | 8.0 |
| Gross profit denominator | $1,200 ÷ $112.50 | 10.7 |
| Gross profit, discounted at 15% a year | monthly profit discounted before summing | 11.5 |
| Gross profit, customer on an annual prepay at 10% off | $1,200 ÷ $101.25 | 11.9 |
| Cash, same annual prepay | $1,620 collected against $1,200 spent | Day 1 |
The discounted row is the smallest of the corrections and the most often described as sophisticated. Money returned in month eleven is worth less than money returned in month one, and charging a 15% annual cost of capital against this customer moves the answer from 10.7 to 11.5 months — about 8%. The denominator choice above it moves the same customer by 33%. The refinement most likely to be skipped matters four times more than the one most likely to be discussed.
The bottom row is the one nobody publishes, and it is the subject of the next section.
Annual prepay moves the cash before it moves the metric
Only one of the eight pages touches billing terms at all — Chargebee, in a line noting that promoting an annual subscription gets you to profit sooner — and none of them works through what it does to the metric. Neither does Bessemer’s widely cited definition. That is the largest hole in the published treatment of it, because billing terms are the single thing that most changes when the money actually arrives.
Put the same customer on an annual contract paid upfront with a 10% prepay discount — $1,620 for the year instead of $1,800 billed monthly. Three numbers follow, and they disagree.
- Cash, on the day the invoice clears. $1,620 lands against $1,200 already spent. The company is $420 ahead on that customer before the product has been used for a day.
- Gross profit, across the twelve months the invoice buys. $1,620 × 75% = $1,215. Against $1,200 of acquisition cost, the customer’s entire first year clears the acquisition cost by $15.
- The metric itself. Recognised revenue is $135 a month, so gross profit is $101.25 a month and the payback period is 11.9 months — slightly worse than the monthly-billed version, because the prepay discount shrank the denominator.
All three are correct. The cash answer says this was an outstanding customer; the annual gross profit says the first year was a coin flip that landed the right way up by fifteen dollars. Annual prepay does not improve unit economics — it front-loads the cash and converts the acquisition cost into a bet on the renewal. If the customer leaves at month twelve, the fifteen dollars is what you got.
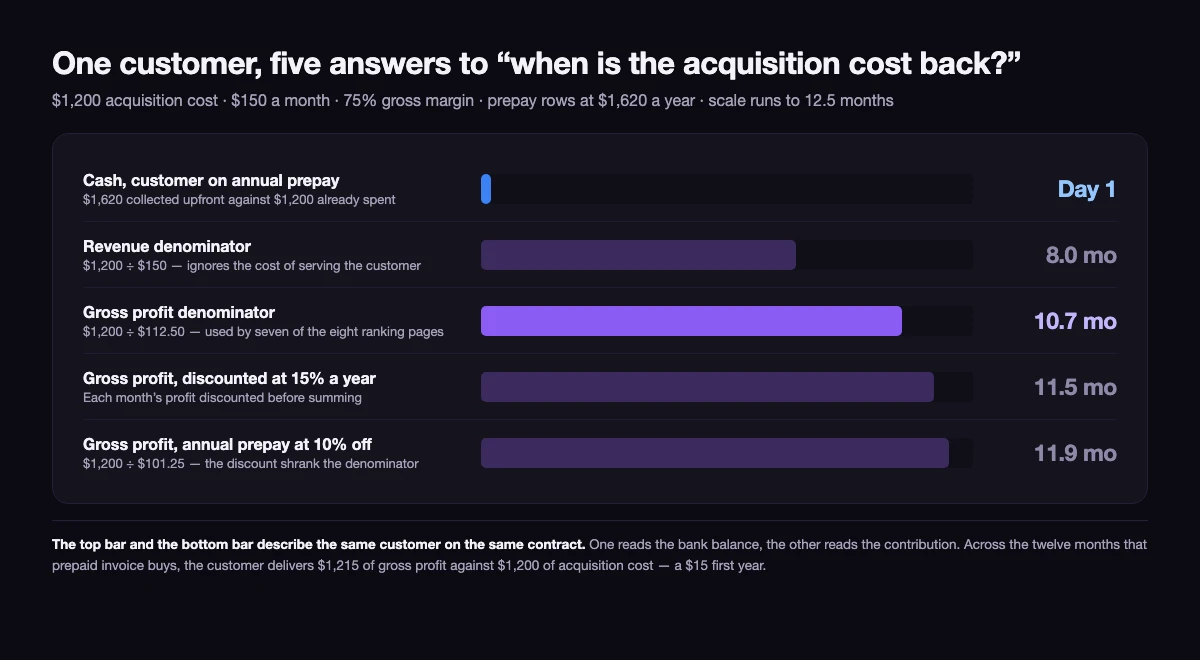
This is also the practical reason a founder and a finance lead can argue about the same customer for an hour without either being wrong. One is reading the bank balance and the other is reading the contribution. A company that bills annually and reports its payback period on cash will look efficient for exactly as long as it is growing.
The twelve-month rule and its single 2013 source
Seven of the eight ranking pages name a target. One says where it came from.
Follow that one attribution and it leads to David Skok’s SaaS Metrics 2.0 on forEntrepreneurs, first published on 16 January 2013 and still updated. It contains both halves of the folklore: “many of the best SaaS businesses are able to recover their CAC in 5-7 months,” and the observation that “the profitability is anemic if the time to recover CAC extends beyond 12 months.” Thirteen years later those two figures are still circulating as the industry standard, mostly without the post attached, and the pages repeating them span two to twenty-eight months on what counts as acceptable.
Measured data does not support one number. High Alpha’s 2025 SaaS Benchmarks report — more than 800 self-reported B2B SaaS companies, surveyed in August and September 2025 — puts the median CAC payback at roughly five months below $1M in annual recurring revenue, eight months at $1–5M, and fourteen months at $5–20M. The direction is the part worth noticing: the median gets longer as companies get bigger, which is what you would expect when a company’s earliest customers arrive through founder time rather than paid media, and later ones arrive through a sales team that costs cash. A seed-stage company comparing itself to a twelve-month rule is holding itself to a soft target. A company at $10M ARR comparing itself to the same rule is holding itself to a hard one.
Two figures are only comparable if they were built the same way. Given that one of the top-ranked pages divides by revenue and the rest divide by gross profit, two companies reporting “eleven months” may be describing businesses that are 33% apart.
The line between a slow payback and a broken one
Length alone does not tell you which side you are on. Three tests do, and all three are arithmetic you already have.
Test one: payback against observed customer life. In a subscription business you can see when customers leave, which is the one advantage contractual businesses have. At 5% monthly logo churn the average customer lasts about twenty months. Our 11.9-month customer therefore delivers roughly eight further months of gross profit — about $825 — for a lifetime gross profit near $2,025 against $1,200 spent. That is a viable customer and a thin one, and no benchmark would have flagged it, because 11.9 months reads as healthy. When payback approaches the customer’s actual life, the business stops being a business and becomes a treadmill.
Test two: payback against runway. Each new customer takes CAC out of the bank now and returns it over the payback period. A company adding customers faster than it recovers them digs the hole deeper the better it sells, which is why the twelve-month convention is a financing threshold rather than a profitability one. The question is not whether the number is good but whether the cash covers the gap between the money going out and the money coming back, at the growth rate you are planning.
Test three: whether the number is an average hiding two businesses. A blended payback across self-serve and sales-assisted customers, or across segments with different contract sizes, will sit somewhere neither of them lives. Split it before you act on it. The same caution applies at the other end of the fraction: what counts as an acquired customer depends on where you draw the handoff, and the line between a marketing-qualified and a sales-qualified lead moves the denominator of the acquisition cost before it ever reaches this calculation.
There is a fourth case that looks like a payback problem and is not. If the period is long because customers churn before they are convinced, the fix is not cheaper acquisition. It is upstream, and a product-market fit survey will tell you faster than another quarter of channel optimisation will.
Payback is a survival metric, the lifetime value ratio is a verdict
The two are routinely presented as alternatives. They answer at different times, which is the more useful distinction.
Payback can be calculated in your first quarter from figures you already possess: what you spent, how many customers you got, what they pay, what they cost to serve. It tells you how long your cash is committed. The lifetime value ratio needs a customer lifetime you have not observed yet — and the assumptions inside that number are where most of the damage happens, which is the subject of the customer lifetime value formula and its cohort version. A young company quoting a ratio is quoting a forecast; a young company quoting a payback period is quoting a measurement.
Two related metrics deserve their own treatment rather than a paragraph here. Whether existing accounts grow or shrink after they land — net revenue retention — is the other half of the pair that High Alpha’s report calls the strongest predictor of durable growth, and it changes the payback answer for any company with meaningful expansion revenue. So does the way annual recurring revenue itself is defined and adjusted, which is less settled than it looks. Neither belongs inside a payback calculation, and both belong in the same review.
Getting the denominator right is not a reporting nicety. It is the difference between an acquisition budget you can defend and one that looks affordable until the cash runs out — which is most of what we work on with SaaS and technology companies before the next quarter’s spend is committed.
07 / Reader questions
Frequently asked questions
01What is a good CAC payback period?
Twelve months is the figure repeated almost everywhere, and it traces to a single source: David Skok's SaaS Metrics 2.0, first published in January 2013, which said profitability is anemic beyond twelve months and that many of the best SaaS businesses recover acquisition cost in five to seven. Measured data since then does not support one number for everyone. High Alpha's 2025 survey of more than 800 self-reported B2B SaaS companies puts the median at roughly five months below $1M ARR, eight months at $1–5M and fourteen months at $5–20M — the median gets longer as companies get bigger.
02How do you calculate the CAC payback period?
Divide the cost of acquiring one customer by that customer's monthly gross profit: CAC ÷ (MRR × gross margin) = months. At $1,200 of acquisition cost, $150 of monthly recurring revenue and a 75% gross margin, that is $1,200 ÷ $112.50 = 10.7 months. Dividing by revenue instead of gross profit gives 8.0 months for the same customer.
03Should the CAC payback period use gross margin or revenue?
Gross margin. Revenue that goes straight back out as hosting, support and onboarding cost cannot repay an acquisition cost, so a revenue denominator always understates the period. The correction is fixed: multiply the revenue answer by one divided by your gross margin. At 75% margin the true period is a third longer than the revenue version; at 50% it is twice as long.
04Does annual upfront billing change the CAC payback period?
It changes the cash answer completely and the gross-profit answer barely at all. A customer on a $1,620 annual prepay covers a $1,200 acquisition cost on the day the invoice clears, but delivers $1,215 of gross profit across the twelve months that invoice buys — $15 above the acquisition cost. The cash clock says day one; the economics say the first year roughly broke even.
05What is a discounted CAC payback period?
The same calculation with each future month's gross profit discounted back to today, on the grounds that money recovered in month eleven is worth less than money recovered in month one. Applying a 15% annual cost of capital to the example above moves the period from 10.7 months to 11.5. The correction is real but small compared with the denominator choice, which moves the same number by a third.
06What is the difference between the CAC payback period and the LTV to CAC ratio?
Payback asks how long the company's cash is tied up in one customer; the ratio asks whether that customer was worth acquiring at all. Payback can be calculated in the first quarter from figures you already have. The ratio needs a customer lifetime you have not observed yet, which is why a young company that quotes a ratio is quoting an assumption.
07Is a 12-month CAC payback period still the standard?
It is still the most quoted number and it is still unsourced almost everywhere it appears. Of the eight pages ranking on this search in August 2026, seven name a target and one attributes it to anything. What they name spans two months to twenty-eight, and they do not all divide by the same denominator — so two companies reporting an identical figure may not be measuring the same thing.