Published
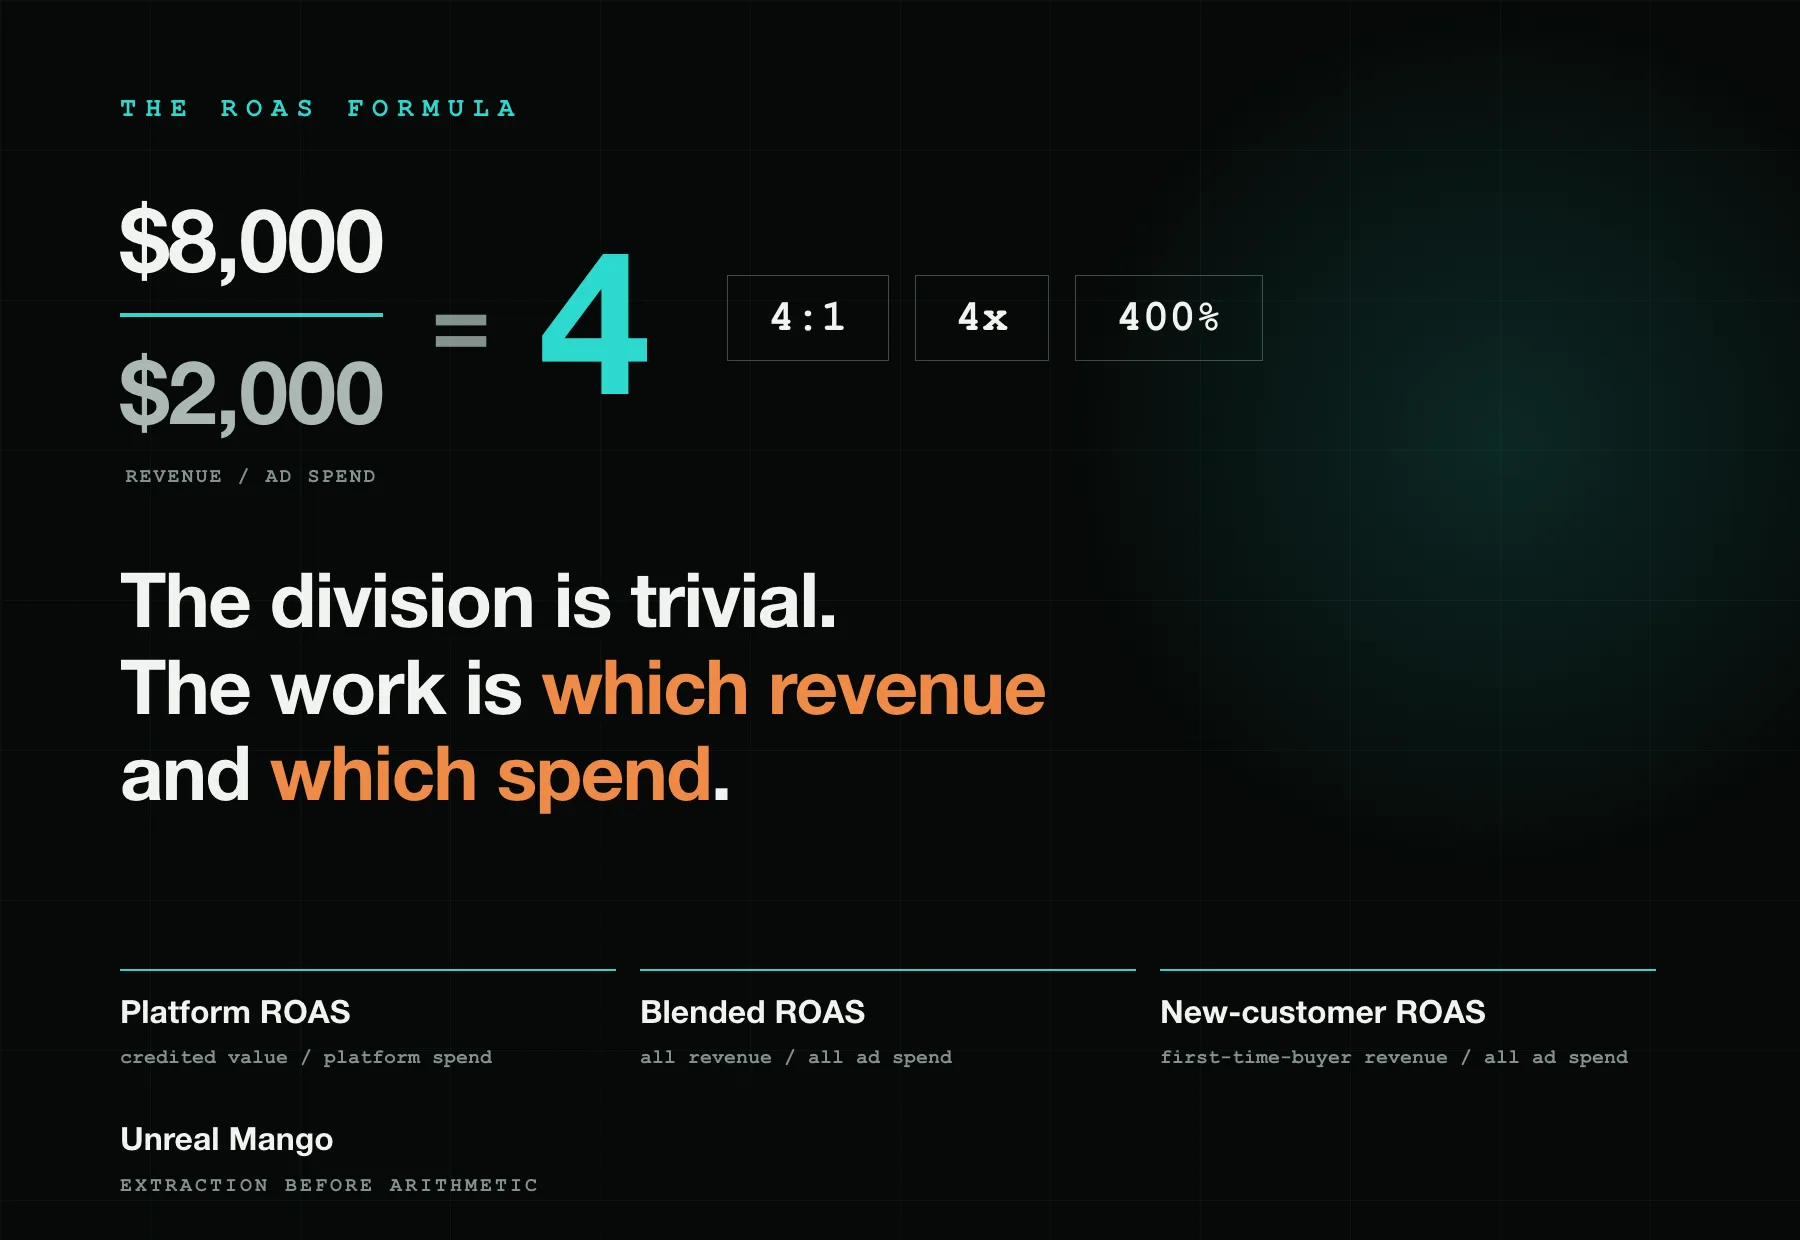
ROAS is revenue divided by the advertising spend that produced it: $8,000 of revenue on $2,000 of spend is a ROAS of 4, written 4x, 4:1 or 400%. The division is trivial. The work is deciding which revenue and which spend go into it, then pulling both out of the right report without quietly changing the window or the field.
How this was checked. Column and field names below were taken from the reporting interfaces themselves in August 2026 — Google Ads, Meta Ads Manager, GA4 and Amazon Ads — and the procedure at the end is the one we run on retainer accounts. Worked figures are illustrative and stated where they appear; no client account is quoted. Benchmarks are deliberately absent: what counts as a good ROAS is a margin question and a different piece of arithmetic from this one.
The ROAS formula, and the three ways the same answer gets written
ROAS = revenue ÷ ad spend. That is the entire formula, and every ranking page agrees on it. What trips people up is that one result has three standard notations, and dashboards mix them freely.
| Revenue | Ad spend | Ratio | Multiplier | Percentage |
|---|---|---|---|---|
| $8,000 | $2,000 | 4:1 | 4x | 400% |
| $5,000 | $2,000 | 2.5:1 | 2.5x | 250% |
| $3,000 | $2,000 | 1.5:1 | 1.5x | 150% |
| $1,600 | $2,000 | 0.8:1 | 0.8x | 80% |
To move between them: multiply the multiplier by 100 for the percentage, and write it against 1 for the ratio. A 400% ROAS is not a 400% return in the sense a finance team would use the word. It is four dollars of credited revenue per dollar spent, and one of those four dollars was the spend. Anything under 100%, or under 1.0x, means the campaign was credited with less revenue than it cost, before a single cost of goods has been subtracted.
Which revenue and which spend: the three input pairs behind one formula
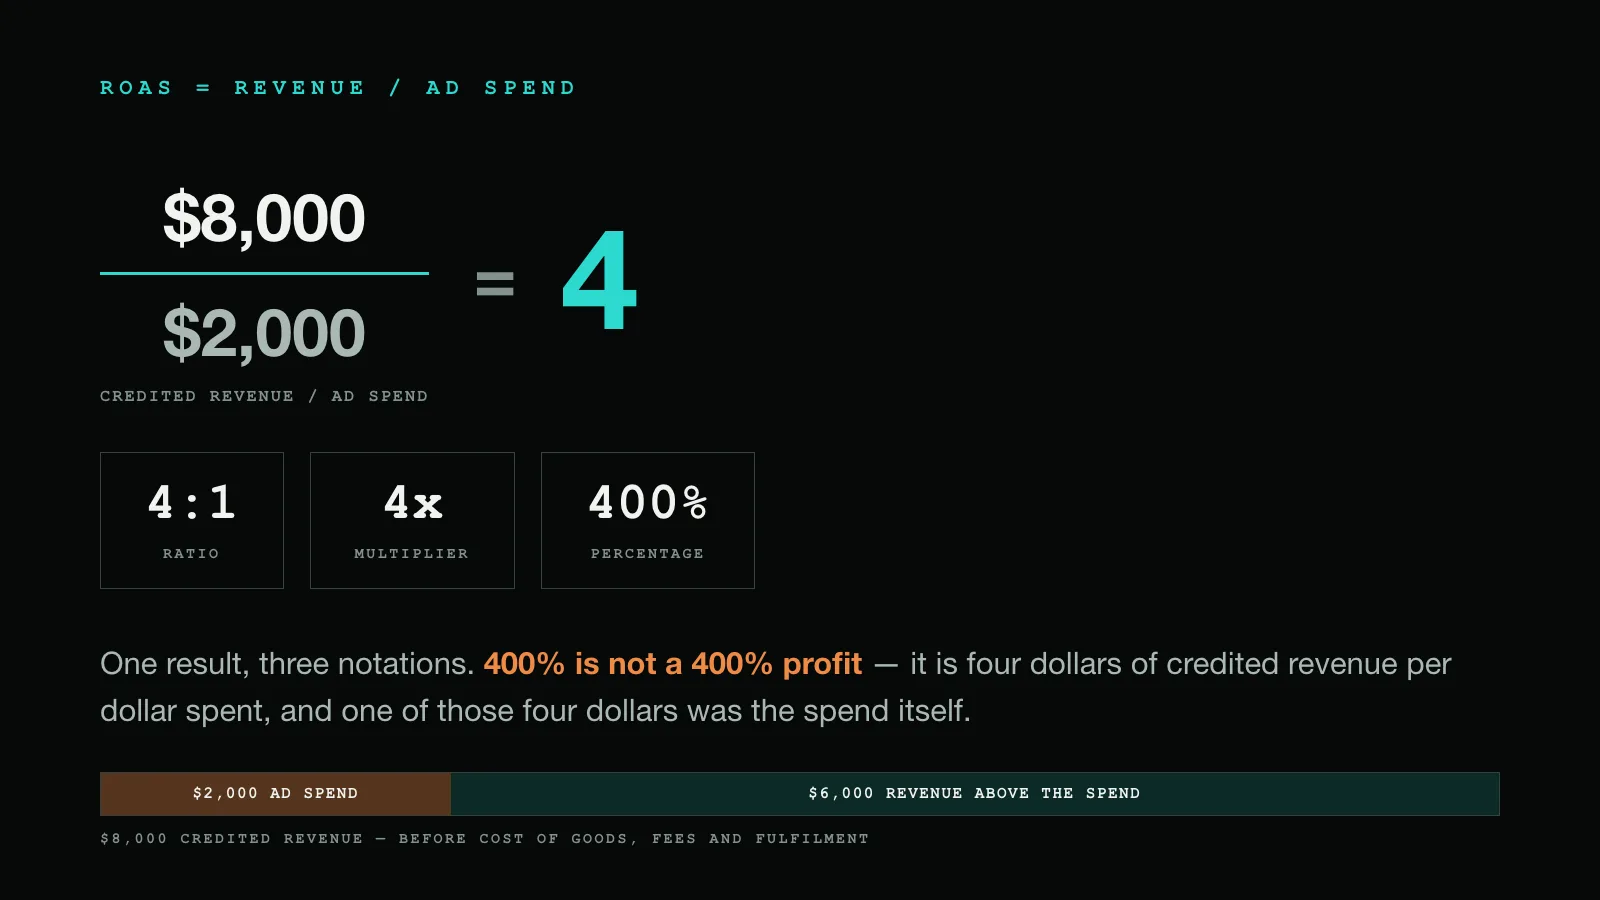
Three input pairs are in common use, and a brand running all three will see three different numbers for the same month. None of them is a wrong calculation. They are different extractions.
| Version | Numerator | Denominator | Exported from | The field that usually goes wrong |
|---|---|---|---|---|
| Platform ROAS | conversion value the platform credited to its own ads | spend on that one platform | the platform’s campaign report | the value in the tag payload, not the one in your ledger |
| Blended ROAS | all revenue in the period, every source | all advertising spend in the period | store or accounting export plus every ad invoice | whether agency fees and tools count as advertising spend |
| New-customer ROAS | revenue from first-time buyers only | all advertising spend in the period | store export filtered on customer status | which system decided the buyer was new |
Pick one, label it every single time you report it, and never compare a number from one row against a number from another. Where the thresholds sit — the ROAS that merely breaks even, and the floor the first-time-buyer version has to clear — is margin arithmetic that belongs in its own calculation, not in the extraction step.
Google Ads: the ratio is already a column, but check which one
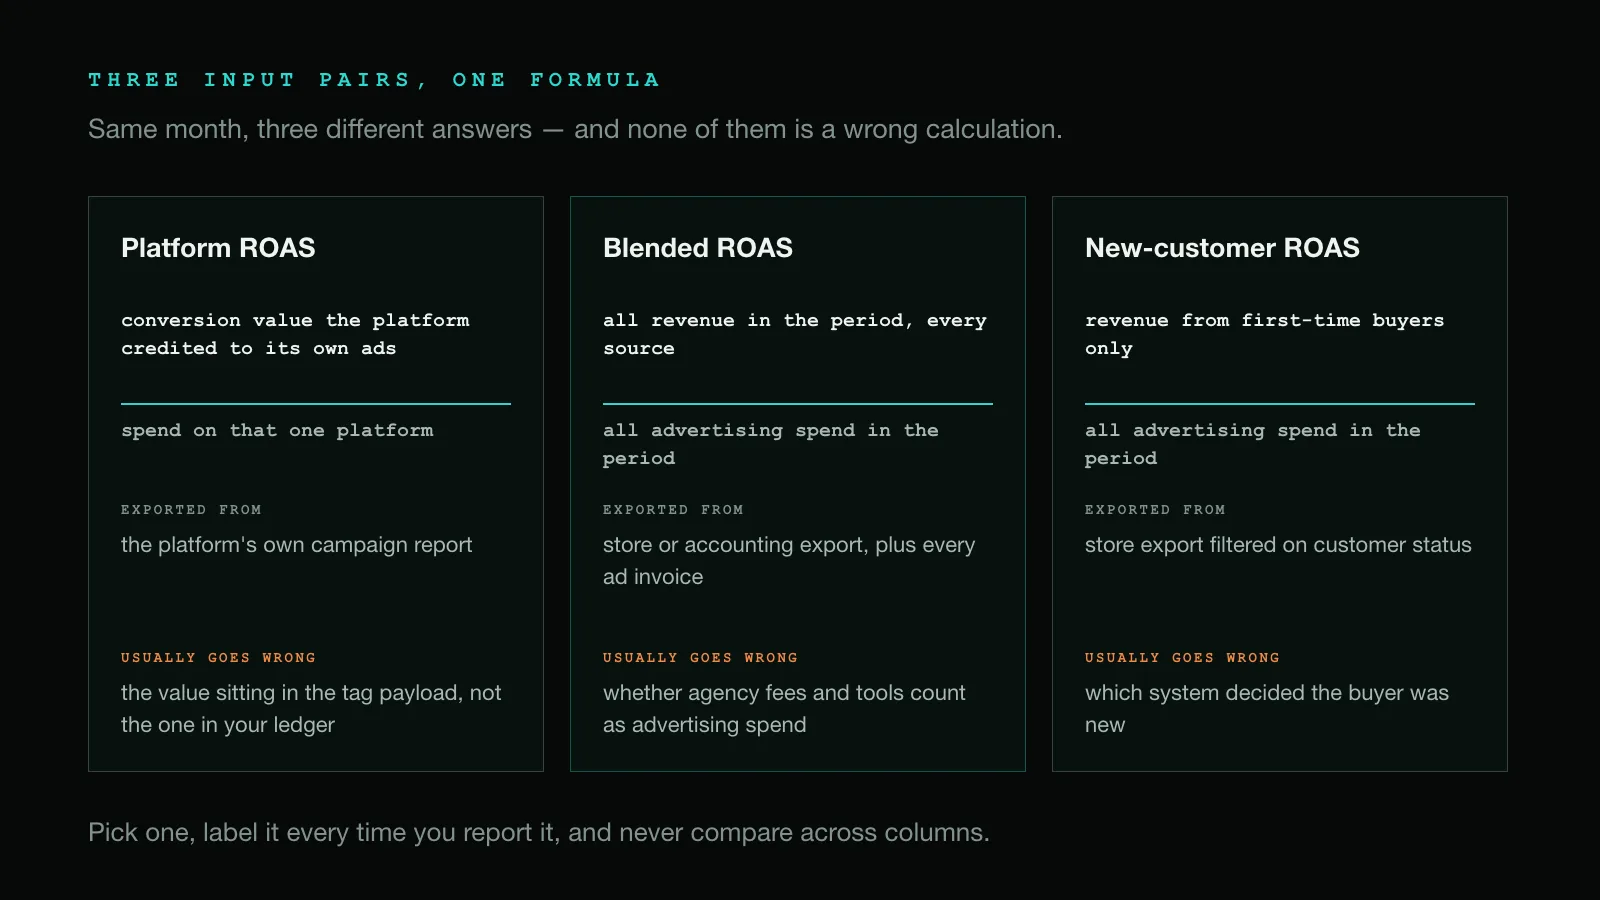
Google Ads calculates ROAS for you and calls it Conv. value / cost. Add it from Columns → Modify columns → Conversions, and it appears as a multiplier: 4.00 means 4x. There is a second column, All conv. value / cost, which uses every conversion action in the account rather than only those marked as primary. The two diverge whenever those secondary actions carry a value of their own — a proxy figure on a lead form, a fixed amount on a tracked call — and in that case the wider column is not the more accurate one. It is a different question being answered.
The value itself is decided where the conversion action was set up, not in the report. A conversion action carries either a fixed value assigned once, or a transaction-specific value read from the tag on the confirmation page. Fixed values are the quiet failure: every order reads as the same amount, so the ratio tracks conversion volume rather than revenue, and nobody notices until average order value moves.
Meta: several purchase ROAS columns, and they cover different surfaces
Meta Ads Manager does not have one ROAS metric. It has a family: Purchase ROAS (return on ad spend) as the aggregate, plus Website purchase ROAS, mobile app purchase ROAS, offline purchase ROAS and on-Facebook purchase ROAS as the components. Reporting the aggregate one month and the website one the next produces a change you will spend an afternoon explaining.
The numerator arrives from the purchase event itself, through the pixel, through server-side event delivery, or through both with deduplication in between. Whatever value sits in that event payload is the revenue Meta divides. The attribution setting lives on the ad set, where it also drives delivery, but Ads Manager lets you re-express finished results under a different window at reporting time. So the reported ROAS for a period that has already closed can move with nothing having changed in the account.
GA4: the revenue field is whatever your purchase event said it was
GA4 exposes Return on ad spend once cost data reaches it — automatically through a linked Google Ads account, or through a cost data import for everything else. Without that import there is no denominator, and the metric stays empty no matter how clean the revenue side is.
The numerator is GA4’s total revenue — purchase revenue plus any subscription and ad revenue the property collects. For a store that only fires purchase, that is the sum of the value parameter on those events and nothing else, which is why publishers and app businesses see a GA4 figure that sits above their store’s. Google’s ecommerce guidance is that value should be total revenue excluding tax and shipping, but nothing in GA4 enforces it: whatever the developer put in the parameter is what the report divides. Check one real order against one real invoice before trusting a series of them.
GA4’s ROAS will not match the number in Google Ads for the same campaign and same dates. That gap has its own set of causes on the counting side, and chasing it to zero is not the goal here — the goal is that each source stays internally consistent month to month.
The denominator: what a platform calls spend, and what your finance team does
The cost column in an ad platform is media cost, and only media cost. It excludes agency management fees, creative production, the tools that produced the reporting, and in several countries the regulatory surcharges and taxes that appear on the invoice rather than in the campaign screen. The invoice total is therefore reliably higher than the number the ROAS column divided by. The full shape of that bill is a separate breakdown, covered in what Google Ads actually costs.
The rule that keeps a series comparable is simple and worth writing down once. Platform ROAS uses platform media cost, because that is what the platform is being measured on. Blended ROAS uses the invoice total plus every other line you have decided counts as advertising. Whichever you choose for the blended figure, it has to stay chosen — adding agency fees to the denominator in March produces a drop that looks like a performance problem and is not.
The numerator: tax, shipping, discounts and the refund that never comes back out
Whether tax and shipping sit inside the credited revenue depends on how the purchase event was built, and both are common. A $100 order can reach the platform as $100, as $108 with tax, or as $115 with tax and delivery, and each version produces a different ROAS on identical performance. Discount codes behave the same way: the value only drops if the event sends the amount actually charged rather than the list price.
Refunds are the larger gap. Ad platforms record conversion value at the moment of purchase, and a later refund does not reverse it on its own — Google Ads accepts adjustments that restate or retract a recorded value, while Meta has no equivalent for a refunded purchase. In categories where returns are routine, a gross platform numerator drifts steadily above the money that stayed in the bank, and the drift grows with volume rather than staying proportional.
So decide the numerator once: gross revenue as credited, or revenue net of refunds. Apply it to every month in the series, including the ones already logged. And keep in mind that even a clean single-order figure is one purchase, not a customer — the customer lifetime value calculation is what turns it into the number a bid should actually chase.
The same ratio inverted: ACoS
One report will hand you the inverse instead. ACoS — advertising cost of sales, the metric Amazon reports by default — divides ad spend by sales, where ROAS divides sales by ad spend, so ROAS = 1 ÷ ACoS. The conversion is exact arithmetic. The habits are not interchangeable: a lower ACoS is better and a higher ROAS is better, so a single dashboard mixing both invites exactly the reading error you would expect. Advertising cost of sales, its break-even threshold and the places where the inversion stops being safe are a separate discipline with a separate denominator, and they are treated on their own page.
Calculating ROAS in Excel or Google Sheets
With revenue in column B and ad spend in column C, ROAS in D2 is =B2/C2. Format the cell as a number with two decimals to read 4.00, or as a percentage to read 400%. For the ratio form, =TEXT(B2/C2,"0.00")&":1" produces 4.00:1 as text.
For a monthly figure, sum both sides over the same date range so neither can silently cover more days than the other:
=SUMIFS(B:B, A:A, ">="&DATE(2026,9,1), A:A, "<="&DATE(2026,9,30)) / SUMIFS(C:C, A:A, ">="&DATE(2026,9,1), A:A, "<="&DATE(2026,9,30))
Two guards are worth adding before the sheet goes to anyone else. Wrap the division in =IFERROR(...,"") so a month with zero spend returns a blank rather than #DIV/0!. And never average a column of monthly ROAS values to get a yearly figure — that treats a $500 month and a $50,000 month as equals. Divide the year’s total revenue by the year’s total spend instead.
The formula has no volume term, so ROAS can rise while revenue falls
ROAS is a ratio, which means it is scale-free: it says nothing at all about how much money moved. Cutting a budget back to whichever slice converts most cheaply reliably raises it.
| Scenario | Ad spend | Credited revenue | ROAS |
|---|---|---|---|
| Full account | $10,000 | $40,000 | 4.0x |
| Cut back to the cheapest-converting slice | $2,500 | $15,000 | 6.0x |
The second row is a 50% better ratio and $25,000 less revenue. Both statements are true, and a report that shows only the ratio shows only the flattering one. The fix costs nothing: report ROAS as a row of three numbers — spend, revenue, ratio — and never as a single figure on a slide.
A monthly ROAS reconciliation, in eight steps
- Fix the window first. A calendar month, identical on both sides. Most reporting disputes are two exports covering different days.
- Pull platform spend from each platform’s campaign report for that window — media cost, matching what the ROAS column divides by.
- Pull the invoice totals as a separate figure: media cost plus surcharges and taxes, plus whatever else you decided counts as advertising — agency fees, production, tools. This is the blended denominator, and the campaign screen will never give it to you.
- Pull platform conversion value for the same window, from the same report, with the ROAS column visible so the platform’s own arithmetic is on screen next to yours.
- Pull total revenue from the store or accounting system for the same window, on the definition you fixed: gross, or net of refunds.
- Pull first-time-buyer revenue if your store flags customer status, using whichever definition it applies — consistently, even if you disagree with it.
- Compute all three ratios in one sheet, on one screen, with the input pair named in the row label: platform ratios on media cost, blended and new-customer on the invoice-based denominator.
- Log spend, revenue and ratio for each version. Three numbers per row, every month, in the same file.
What that builds is a series, and the series is the deliverable. One month’s ROAS in isolation answers nothing: it cannot separate a pricing change from a mix change from a tracking change. Twelve months of the same three extractions, taken the same way, will show you which of those happened — which is the actual job of paid media management, and the reason the extraction rules get written down before the reporting starts rather than after the first argument about it.
12 / Reader questions
Frequently asked questions
01What does 1.5 ROAS mean?
A 1.5 ROAS means $1.50 of revenue was credited for every $1.00 of ad spend, written 1.5x, 1.5:1 or 150%. It is a gross-revenue ratio rather than a profit figure: the $1.00 of spend sits inside the $1.50, and nothing has yet been taken out for cost of goods, payment fees or fulfilment.
02Is 0.8 ROAS good?
A 0.8 ROAS means 80 cents of credited revenue per dollar spent, so the campaign was credited with less revenue than it cost — before the cost of goods, payment fees or fulfilment come out at all. Below 1.0 is the only verdict the formula reaches on its own. Above 1.0, the answer depends on your margin, which is a separate calculation.
03Is 300% ROAS good?
A 300% ROAS is 3x — three dollars of credited revenue per dollar spent — and whether that is good depends on your margin, because the formula passes no judgement above 1.0. The percentage form is where most confusion starts: 300% return on ad spend is not a 300% profit, and one of those three dollars was the spend itself.
04How do you calculate ROAS in Excel?
ROAS in Excel or Google Sheets is a single division: =B2/C2 with revenue in B2 and ad spend in C2. Format the cell as a number with two decimals for the 4.00x form, or as a percentage for the 400% form. For a whole month, wrap both sides in SUMIFS over the same date range so the two totals cover exactly the same days.
05Why do Google Ads, Meta and your store report different ROAS for the same campaign?
Because each one divides a different pair of numbers. Every ad platform counts the conversion value its own tag credited to its own ads inside its own attribution settings, while your store counts orders it actually shipped and refunded. The practical rule is to compare each source against its own history and never against another source's number.