Published
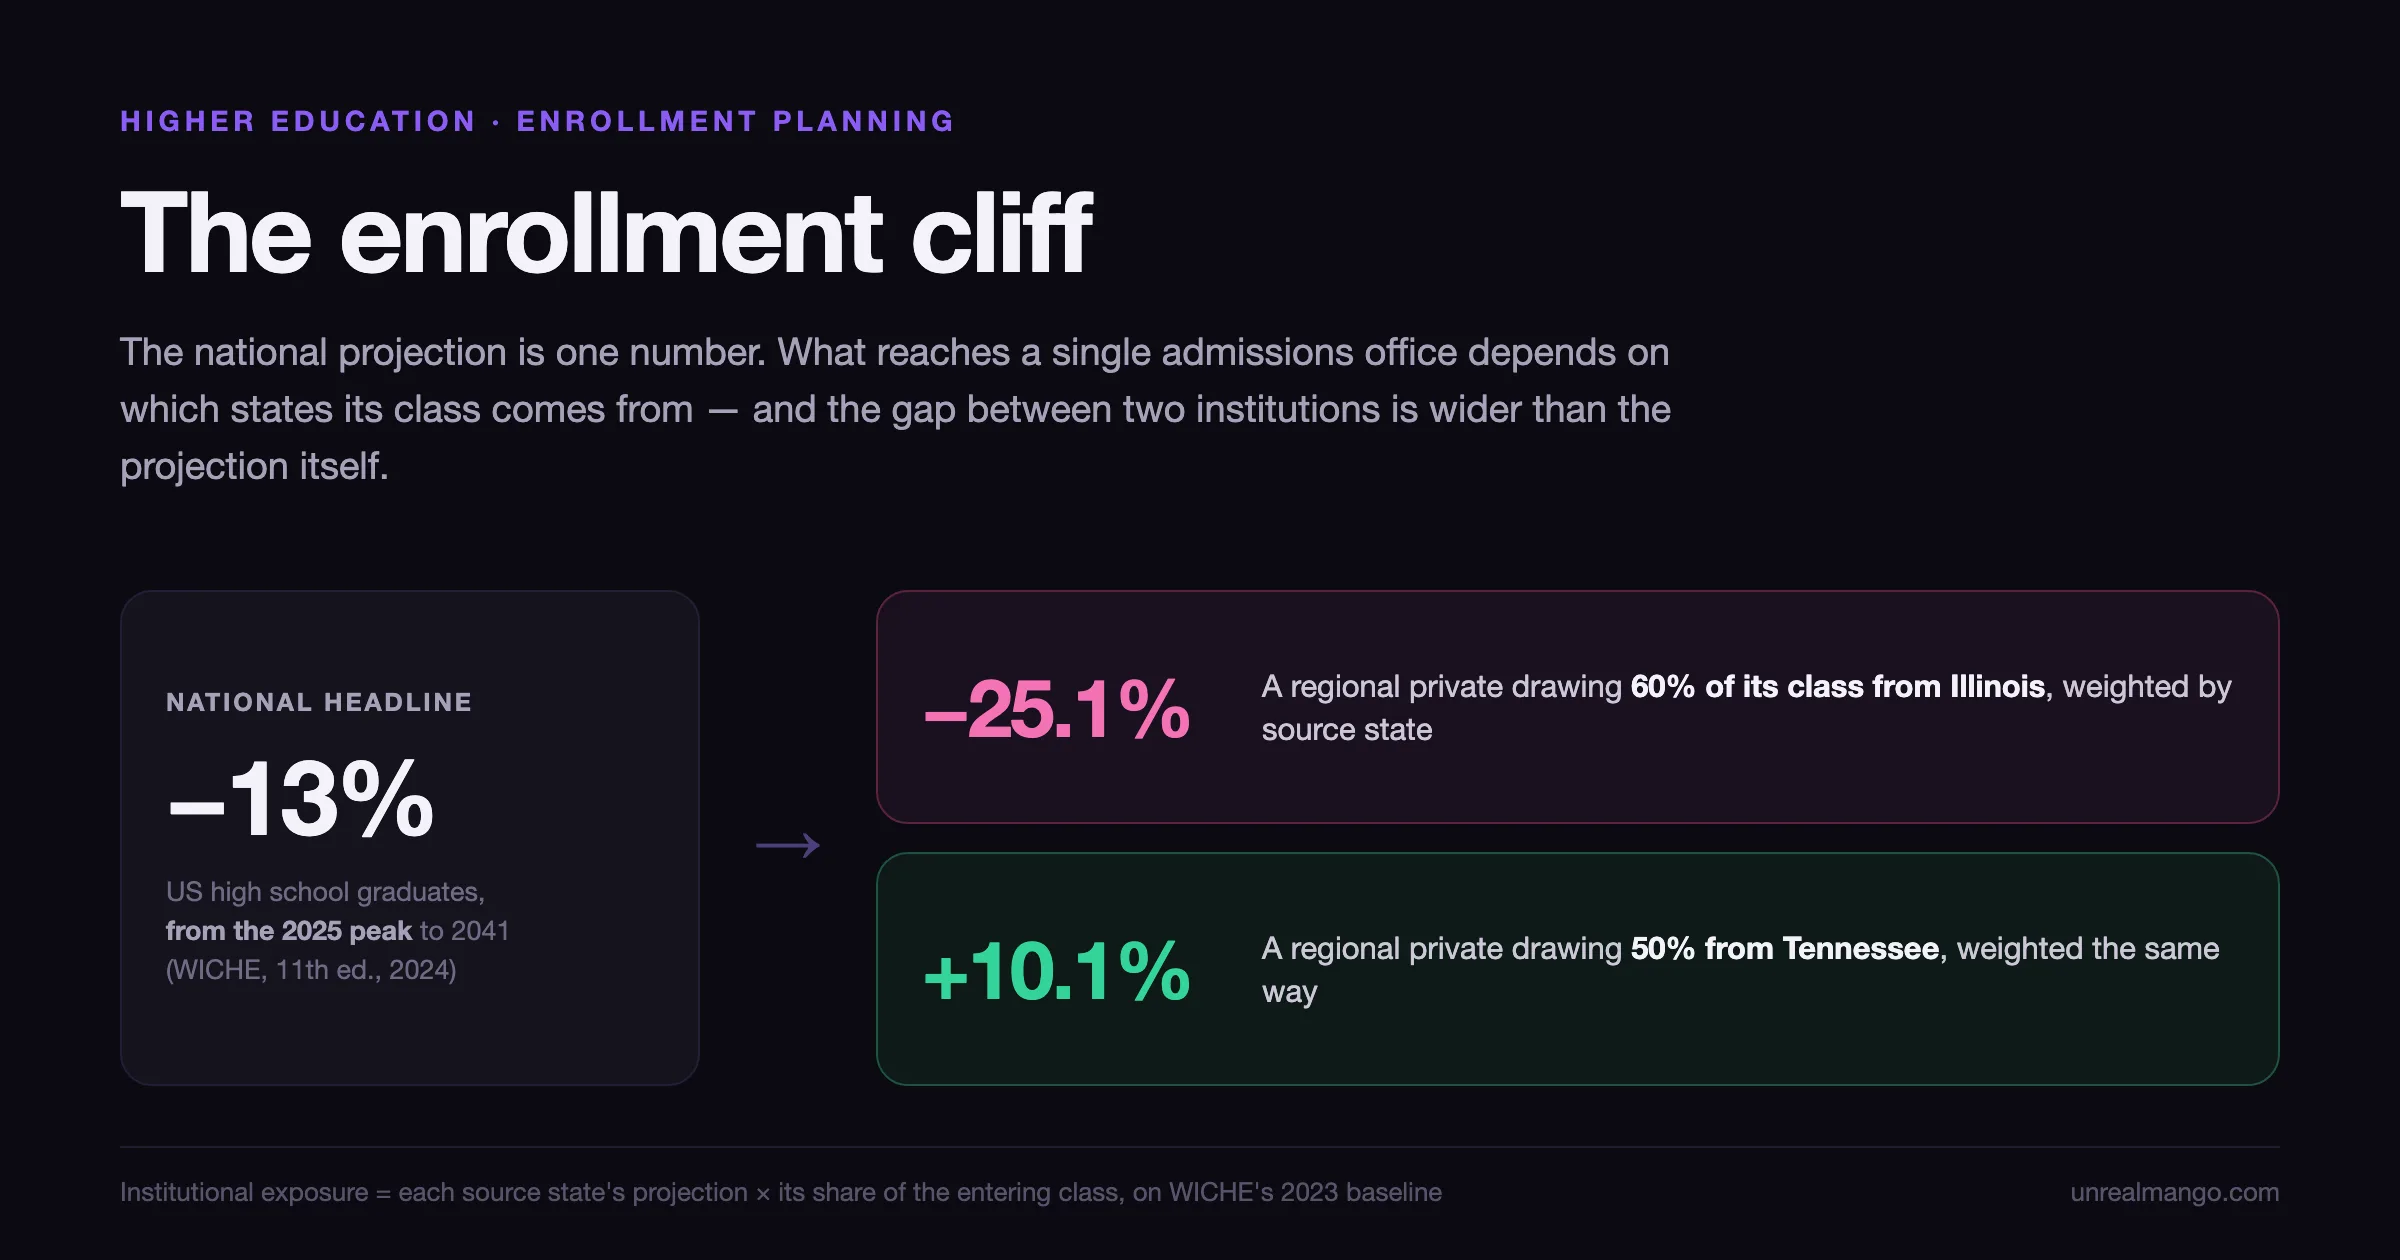
The enrollment cliff is the projected fall in US high school graduates from a peak of about 3.9 million in 2025 to roughly 3.4 million in 2041 — 13% below the peak. Spread across those sixteen years it removes an upper bound of about 22,000 first-year students a year nationally, about 0.14% of undergraduate enrollment. The national number is not your number.
Two qualifiers before anything is budgeted against that. The 22,000 is an upper bound, because it applies the full high-school-graduate decline to every first-year student including adults and international students, who are not drawn from that pool. And the average conceals a spread of more than 35 percentage points between institutions, which is the part that decides whether this is a rounding error or an existential problem for a particular admissions office.
How this was checked. The demographic projection is WICHE’s Knocking at the College Door, 11th edition, published December 2024; the 12th edition is not due until roughly 2028, so the 11th is current. Enrollment actuals come from the National Student Clearinghouse Research Center’s Final Fall Enrollment Trends, 15 January 2026, and Final Spring Enrollment Trends, 4 June 2026. Discount rates come from NACUBO’s 2025 Tuition Discounting Study, released 1 June 2026 across 258 private nonprofit institutions. Distance and residency figures come from NPSAS:20 via TICAS and from IPEDS via College Board. For this query in the United States, the entire first screen belongs to an AI Overview, and the seven organic results below it are national journalism — NPR and The New Yorker — plus College Board, a governance association, a Reddit thread and two vendor explainers. Every one of them describes the demography. None of them sizes an individual institution’s exposure to it, and none prices the standard response. That is what this page adds.
The cliff is a projection about 18-year-olds, and three layers sit between it and your class
The word “cliff” describes the chart of births, not the chart of enrollment. US births peaked at 4,316,233 in 2007 and have fallen since; provisional 2025 data puts them at 3,606,400, about 16% below that peak. The 2007 cohort turned 18 in 2025, which is precisely why WICHE places the graduate peak there.
Everything after that is translation, and each layer has its own dynamics.
| Layer | Current figure | What moves it | Source |
|---|---|---|---|
| Births | 4.32M (2007 peak) → 3.61M (2025, provisional) | Fertility, immigration | NCHS Data Brief 60 (2011); VSRR Report 43, 9 April 2026 |
| High school graduates | ~3.9M (2025 peak) → ~3.4M (2041) | The birth cohort, 18 years later, plus completion rates | WICHE, Knocking at the College Door, 11th ed., Dec 2024 |
| College-going rate | 62% (2022), down from ~70% (2016) | Perceived value of a degree, labour market, price | NCES |
| First-year enrollment | 2.5M (fall 2025), −0.2% YoY | All of the above, plus adult and international entrants | NSC, 15 January 2026 |
| Total undergraduate enrollment | 16.2M (fall 2025), +1.2% YoY | Retention and the other 85% of the body | NSC, 15 January 2026 |
Two things follow that most coverage skips.
First, the college-going rate is a larger lever than the demography. It has already moved eight points in six years, against a demographic projection of thirteen points over sixteen. WICHE’s own arithmetic, reported by Higher Ed Dive, is that raising the college-going rate by half a percentage point a year would more than offset the demographic shortfall. That does not make the projection wrong. It makes the projection one input among several, which is a different thing from destiny.
Second, the cliff is a flow shock, not a stock shock. It changes the size of each entering class. First-year students are about 2.5 million of 16.2 million undergraduates — roughly one in six. A shrinking entering class works through the standing enrollment over four years, which is why total enrollment can rise in the same year the feeder population turns down. Anyone comparing this year’s total enrollment against the projection is comparing a stock to a flow and will reach the wrong conclusion in either direction.
Spread across sixteen years, a 13% fall from the 2025 peak is an average of 0.87% a year. The path is not uniform, and no single year will look like the average. But 0.87% a year applied to 2.5 million first-year students is that upper bound of roughly 22,000 students — nationally, across more than 3,000 institutions.
What the enrollment data has actually done since the projection landed
The projection was published in December 2024. Here is every national reading since.
| Term | First-year enrollment | Total undergraduate | Total postsecondary |
|---|---|---|---|
| Fall 2024 | +5.5% (+130,000) | +4.7% | +4.5% |
| Fall 2025 | −0.2% (~2.5M) | +1.2% (16.2M) | +1.0% (19.4M) |
| Spring 2026 | — | +1.3% (15.5M) | +1.0% (18.6M) |
Source: National Student Clearinghouse Research Center. Fall 2024 figures are the corrected Current Term Enrollment Estimates of 23 January 2025; fall 2025 is Final Fall Enrollment Trends, 15 January 2026; spring 2026 is Final Spring Enrollment Trends, 4 June 2026.
There is a widely-circulated figure that contradicts this table, and it is worth killing explicitly because it still appears in strategy decks. In October 2024 the Clearinghouse’s preliminary report showed freshman enrollment down 5%. Trade press ran it as the arrival of the cliff. On 13 January 2025 the Clearinghouse announced a methodological error: its preliminary pipeline had mislabelled some genuine freshmen as dual-enrolled high school students, undercounting freshmen and overcounting dual enrollment. The corrected estimate, built on 97% institutional coverage, showed freshman enrollment up 5.5%. Inside Higher Ed appended a formal retraction to its story. The swing between the retracted and corrected figures is roughly ten points, and in the opposite direction.
The practical rule this leaves behind is worth more than the correction itself: any freshman or dual-enrollment number sourced to an October–December 2024 Clearinghouse preliminary release is void. Check the date before a number goes into a board deck, because the −5% is still in circulation.
None of this means the projection is wrong. It means the leading edge has not reached enrollment data yet, which is exactly what a 2025 graduate peak predicts. What it does mean is that an institution reporting an enrollment decline in 2024, 2025 or 2026 cannot attribute it to demography. Nationally the pool grew in those years. A decline against a growing national baseline is a competitive loss, and it responds to completely different work than a demographic decline does.
Sizing your own exposure: the segments that sit on the cliff, and the ones that never did
The cliff moves one specific population: traditional-age, domestic, first-time degree-seekers. Federal data never publishes that exact cross-tab — IPEDS collects age and first-time status in separate components and does not cross them — so the honest construction is to bound it. First-time full-time degree-seeking undergraduates numbered 2,184,317 in the fall 2023 IPEDS retention cohort; all first-year students, any age and any attendance status, numbered about 2.5 million in fall 2025. That puts the directly exposed population somewhere between 13% and 15% of undergraduate enrollment, before subtracting the adults and international students inside it.
The other 85% is not immune to everything. It is immune to this, because it is driven by other variables.
| Segment | Latest national figure | Latest move | What actually drives demand | Exposed to the cliff? |
|---|---|---|---|---|
| First-time traditional-age degree-seekers | ~2.2M (IPEDS FTFT, fall 2023) | −0.2% all first-years, fall 2025 | Size of the 18-year-old cohort | Directly |
| Adult undergraduates, 25+ | 3.85M, 24.9% of undergrads (fall 2021) | +3.3% continuing (ages 25–29), fall 2025 | Labour market, counter-cyclically | No — but see below |
| Transfer students | 13.1% of continuing undergrads (fall 2024) | +4.4%, third consecutive year of growth | Stopout return, cost arbitrage | No |
| Dual enrollment | 2.8M high schoolers (2023–24) | +12.7% (+300,000) | State policy and funding | Inversely — same cohort, earlier |
| Undergraduate certificates | 579,400 awarded (2024–25) | +10.2% enrollment, spring 2026 | Labour market, and the 18–20 cohort | Partly |
| Graduate | 3.1M (spring 2026) | −0.1% | International flows, labour market | No |
| International | 1.18M (2024–25) | New enrollment −17%, fall 2025 | US visa policy | No — exposed to something else |
| Community colleges | 5.8M (spring 2026) | +3.1% | Dual enrollment, vocational credentials, transfer-in | No |
Sources: NSC Research Center (fall 2025, spring 2026, transfer and certificate reports), NCES Digest table 303.45, CCRC using IPEDS 2023–24, IIE Open Doors 2025 and NAFSA’s fall 2026 outlook of 11 August 2026.
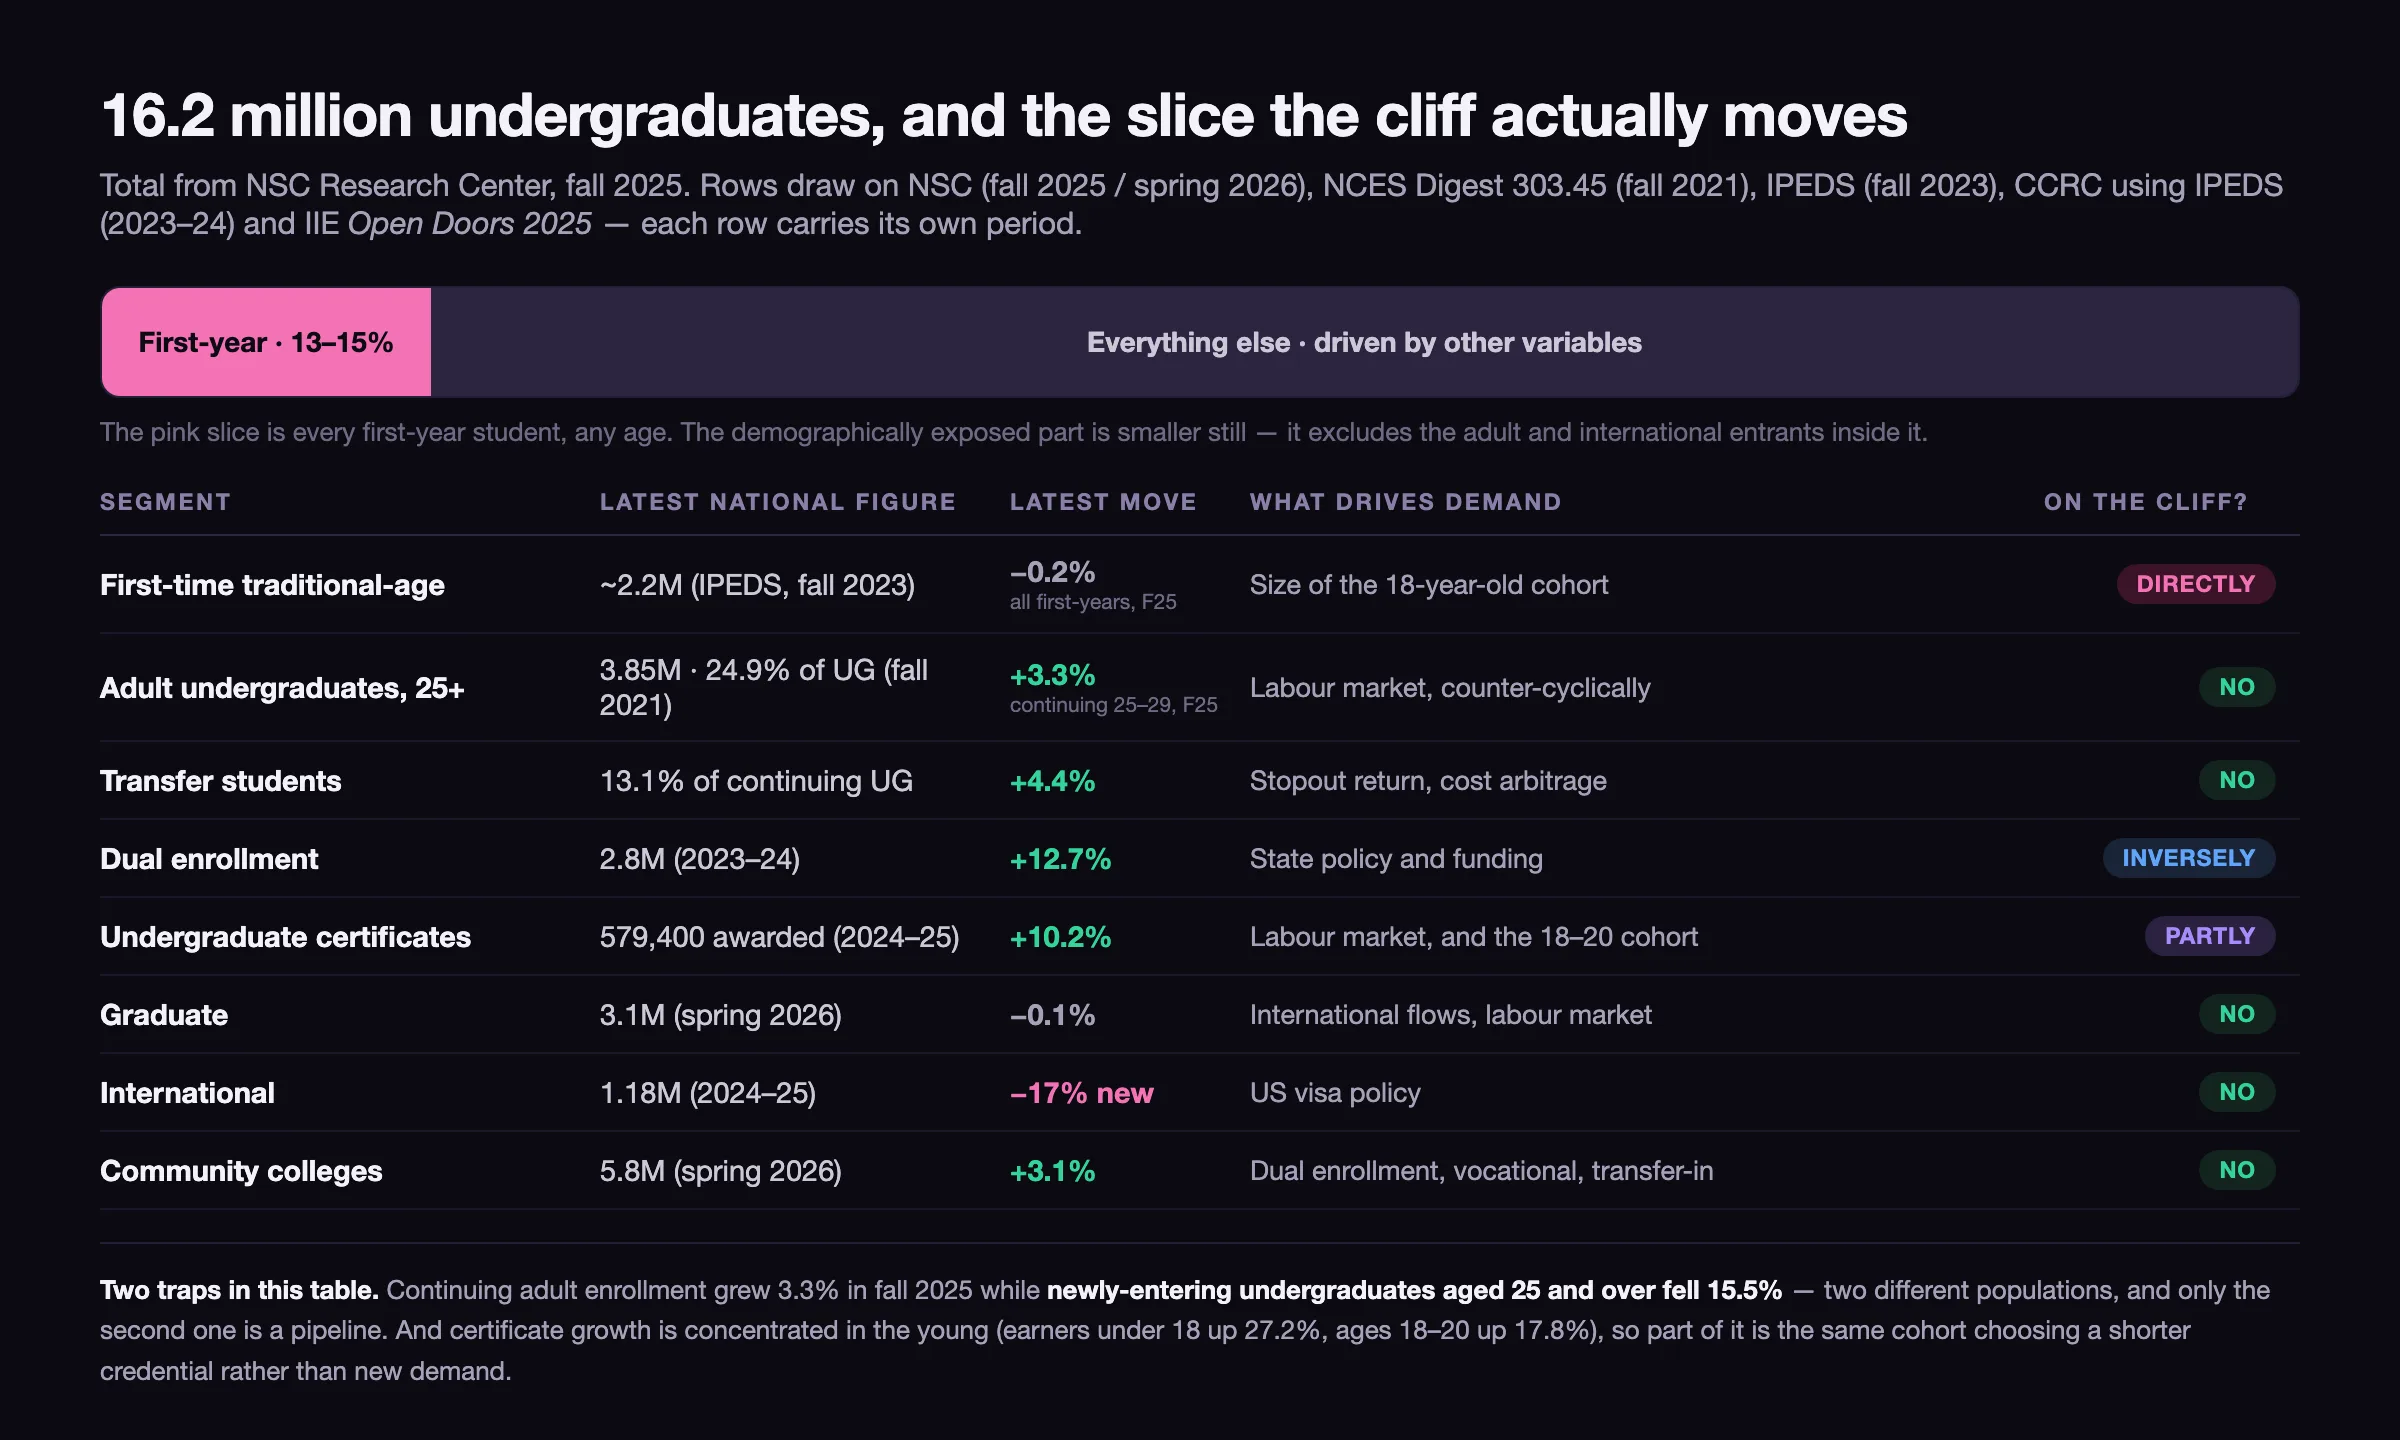
Two lines in that table are traps, and both are load-bearing.
Adults are a labour-market bet, not a demographic hedge. Continuing enrollment among students aged 25–29 rose 3.3% in fall 2025 — the number usually quoted to argue that adults will absorb the cliff. In the same report, newly-entering undergraduates aged 25 and over fell 15.5%, more than 35,000 students, with a steeper drop at private four-year institutions. Those are two different populations, not contradictory data: the students already enrolled kept going, and the new ones did not arrive. Adult enrollment moves counter-cyclically, so a tight labour market suppresses exactly the entry the strategy depends on. An institution that answers a demographic problem with an adult-learner strategy has swapped an exposure it can forecast for one it cannot.
Certificate growth is largely the same 18-year-olds, choosing differently. Certificates hit a decade high of 579,400 in 2024–25, and the growth is concentrated in the young: earners under 18 up 27.2% and aged 18–20 up 17.8% in 2023–24. Some of that is genuine expansion of the credential market. Some of it is a traditional-age student who would previously have enrolled in a degree choosing a shorter one instead. Read as new demand, it flatters the forecast; read as substitution, it is the college-going rate falling with extra steps.
The one segment that is genuinely collapsing is not on the cliff at all. International new enrollment fell about 17% in fall 2025, and NAFSA’s outlook of 11 August 2026 projects the 2026–27 total between 1.06 and 1.10 million against 1,177,766 in 2024–25 — between roughly 73,000 and 121,000 fewer students, driven by visa processing and graduate applications rather than by anybody’s birth rate. Institutions that built a hedge against demography out of international enrollment bought a different risk, and it arrived first.
Two institutions, the same national headline, and a 34-point gap in real exposure
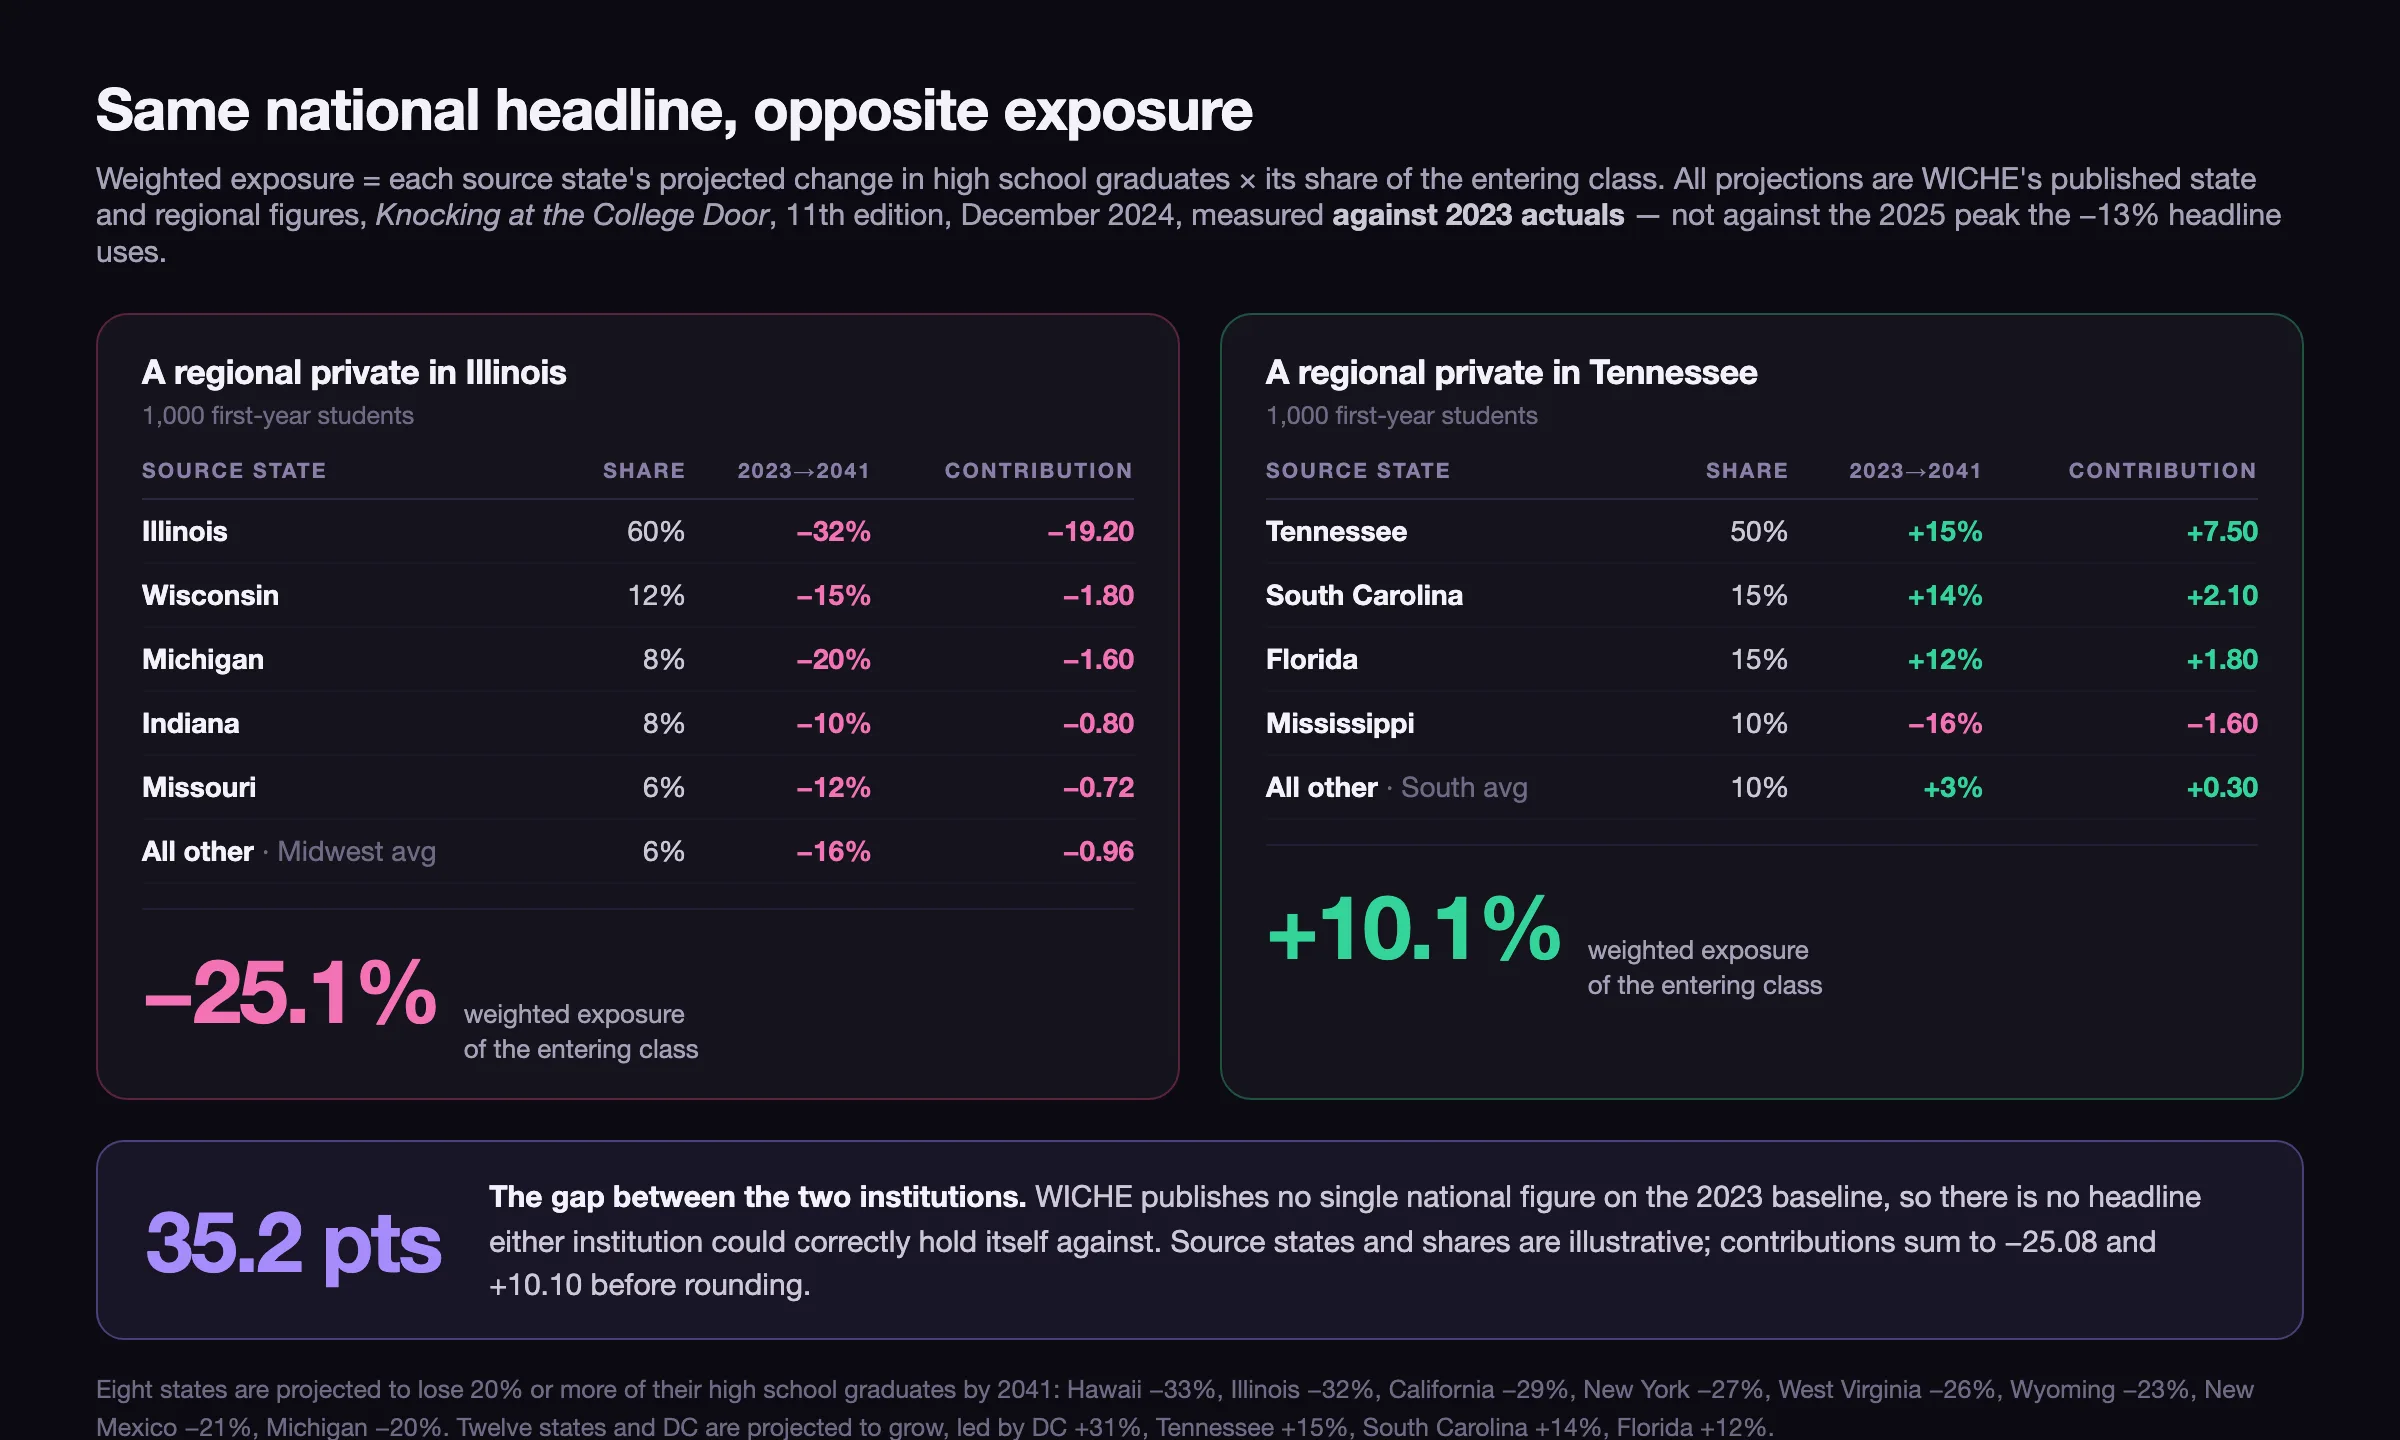
WICHE’s projection is not national in any way that matters operationally. Eight states are projected to lose 20% or more of their high school graduates between 2023 and 2041 — Hawaii −33%, Illinois −32%, California −29%, New York −27%, West Virginia −26%, Wyoming −23%, New Mexico −21%, Michigan −20%. Twelve states and DC are projected to grow: DC +31%, Tennessee +15%, South Carolina +14%, Florida +12%. By region, the South grows 3% while the West falls 20%, the Northeast 17% and the Midwest 16%. Five high-population states account for roughly three-quarters of the entire national decline.
That means exposure is a property of your recruitment territory, and it is computable. One baseline warning first, because it decides whether the calculation is valid: WICHE publishes the state and regional figures against 2023 actuals, while the headline 13% is measured from the 2025 peak. WICHE does not publish a single national percentage on the 2023 baseline, so there is no clean national operand to hold an institution against — which is itself a reason to compute your own rather than borrow one. Everything below stays on the 2023 baseline throughout, including the residual bucket, which takes its region’s published average rather than an invented national figure.
A regional private in Illinois, 1,000 first-year students:
| Source state | Share of class | Projection, 2023→2041 | Contribution |
|---|---|---|---|
| Illinois | 60% | −32% | −19.20 |
| Wisconsin | 12% | −15% | −1.80 |
| Michigan | 8% | −20% | −1.60 |
| Indiana | 8% | −10% | −0.80 |
| Missouri | 6% | −12% | −0.72 |
| All other, at the Midwest average | 6% | −16% | −0.96 |
| Weighted exposure | 100% | −25.1% |
A regional private in Tennessee, 1,000 first-year students:
| Source state | Share of class | Projection, 2023→2041 | Contribution |
|---|---|---|---|
| Tennessee | 50% | +15% | +7.50 |
| South Carolina | 15% | +14% | +2.10 |
| Florida | 15% | +12% | +1.80 |
| Mississippi | 10% | −16% | −1.60 |
| All other, at the South average | 10% | +3% | +0.30 |
| Weighted exposure | 100% | +10.1% |
Source states and shares are illustrative; every projection is WICHE’s published state or regional figure on the 2023 baseline. Each contribution is the share multiplied by the projection, and the contributions sum to the weighted exposure — −25.08 and +10.10 before rounding.
The gap between those two institutions is 35.2 points. One faces a quarter of its entering class disappearing across the projection window; the other faces a tenth more of it than it has now. Read the national headline as a planning input and the Illinois institution under-provisions badly while the Tennessee one spends against a decline it does not have. This calculation takes an afternoon with an IPEDS residence-and-migration file and a spreadsheet, and it is the single highest-value analysis available in this vertical — because it converts a headline that describes no actual institution into a number that can be budgeted against.
One layer sits underneath the volume numbers and is usually treated as a separate topic. The composition of the graduating class changes faster than its size: between 2023 and 2041 WICHE projects Hispanic graduates up 16% and multiracial graduates up 68%, against White graduates down 26% and Black graduates down 22%. The projected share of public high school graduates who are White falls from 47% to 39% while the Hispanic share rises from 27% to 36%. An institution whose recruitment messaging, channel mix and financial aid communication were built for the 2015 class is facing a targeting problem before it faces a volume problem, and the targeting problem arrives first.
Why “widen the funnel” is the most expensive available answer
The standard institutional response to a shrinking pool is to reach further: recruit at greater distance, lower the academic band, buy more names, discount harder. It is the most expensive of the available responses, because it degrades the conversion divisors at the same time as it raises unit cost — and because most of its price is paid somewhere the marketing budget cannot see.
Start with how far students actually go. Analysis of NPSAS:20 data by Nick Hillman for TICAS puts the median distance from home to college at 17 miles, with 69% of undergraduates enrolling within 50 miles of their permanent address. That median has moved two miles in twenty years, from 15 in 2000. On the residency measure, 73% of first-time first-year students enrolled in their home state in fall 2022, down from 75% in 2018–20.
Now look at where the growth strategies are pointed. EAB’s analysis of fall 2024 IPEDS, published 11 August 2026, finds that in 78% of states the median out-of-state student travelled at least 500 miles, with western small privates drawing out-of-state students from a median of 1,162 miles. Widening the funnel geographically does not mean recruiting the 69% a little further out. It means competing for the tail — a population that behaves differently, converts differently, and is being pursued by everyone else running the same play.
The media cost of reaching that tail is the expensive kind. EducationDynamics’ 2026 benchmarks report puts non-brand paid search CPCs up 30.9% year over year against total sector digital media spend passing $2.77 billion, with around 78% of education-related searches now returning an AI Overview. Broad category benchmarks tell a different story — LocaliQ’s WordStream benchmarks for 2026 show the same “Education & Instruction” CPC falling 22.8% — and the difference is the whole point: that bucket mixes tutoring, test prep and driving schools, and it is dominated by cheap branded and long-tail terms. The non-brand keywords you have to buy to reach a student who has never heard of you are the ones inflating.
The supply of purchasable names is tightening at the same time. 94% of four-year private institutions still buy high school student names, per RNL’s 2025 Marketing and Recruitment Practices report, fielded in autumn 2024 across 114 institutions of which 50 are four-year privates. But College Board moved off per-name licensing to subscription access plans in 2023, removed race and ethnicity filters from Search and Connections in June 2025, and stated that its 2025–26 pricing adjustment reflects “current market conditions” without publishing a magnitude. The last publicly documented per-name price is $0.50, from autumn 2021. A vertical where the primary prospecting input has no published price and a shrinking, opt-in-gated supply is not a vertical where scale is cheap.
And the divisors move the wrong way while all this happens. Yield fell from 32.1% for fall 2019 to 30.2% for fall 2022, per NACAC’s analysis of IPEDS. That is an unweighted average across institutions; the aggregate admit-to-enrol ratio computed from the same data is lower — 22.5% at publics and 18.6% at private nonprofits — and the two are not interchangeable inside a cost model. Applicants filed 6.59 applications each through 1 March of the 2025–26 Common App season, up 3% on the same point a year earlier — a partial-season figure, and lower than the 6.80 full-season average for 2024–25 for that reason alone. And 9.7% of applications now arrive with no prior inquiry record at all, against about 1% in 2020 — which means a tenth of the funnel is invisible to the measurement the widening strategy is being judged on. Every one of those makes the denominator of cost per enrolled student worse at the same moment the numerator gets bigger, which is the same compounding failure as treating every lead in the funnel as equally qualified.
The price of the marginal student is paid in discount, not in media
Here is the number that reframes the whole budget conversation, and it is absent from every page ranking for this term.
NACUBO’s 2025 Tuition Discounting Study reports average net tuition and fee revenue of $21,300 per first-time full-time undergraduate in 2024–25, at an actual freshman discount rate of 54.5%. Those two figures imply a gross of about $46,800 and an institutional grant of roughly $25,500 per first-year student. Set that against RNL’s median all-in recruitment cost of $2,795 per enrolled student at private four-year institutions.
| Line | Per first-year student | Source |
|---|---|---|
| Implied gross tuition and fees | ~$46,800 | Derived from the two NACUBO figures below |
| Institutional grant aid (the discount) | ~$25,500 | NACUBO 2025 study, 54.5% actual rate, AY2024–25 |
| Net tuition and fee revenue | $21,300 | NACUBO 2025 study, AY2024–25 |
| All-in recruitment cost | $2,795 | RNL, 2022 Cost of Recruiting report, private four-year median |
| Discount as a multiple of recruitment cost | ~9× |
The two sources cover different years and different samples, so treat the multiple as an order of magnitude rather than a measured ratio. Even so, the direction is not close: the institution spends roughly nine dollars buying the student’s decision through the aid office for every dollar it spends buying their attention through marketing.
That changes what “expensive” means. At an implied $46,800 gross, one point of discount rate costs about $470 per enrolled student — a sixth of the entire per-student recruitment budget, spent invisibly. NACUBO’s current-year estimate moves the freshman rate from 54.5% to 57.1%, the highest in a decade. Those 2.6 points are about $1,217 per student, or 44% of what recruiting costs in total. Real net tuition revenue per first-time student fell 2.2% in the same year: the discount is buying volume at the price of yield per student.
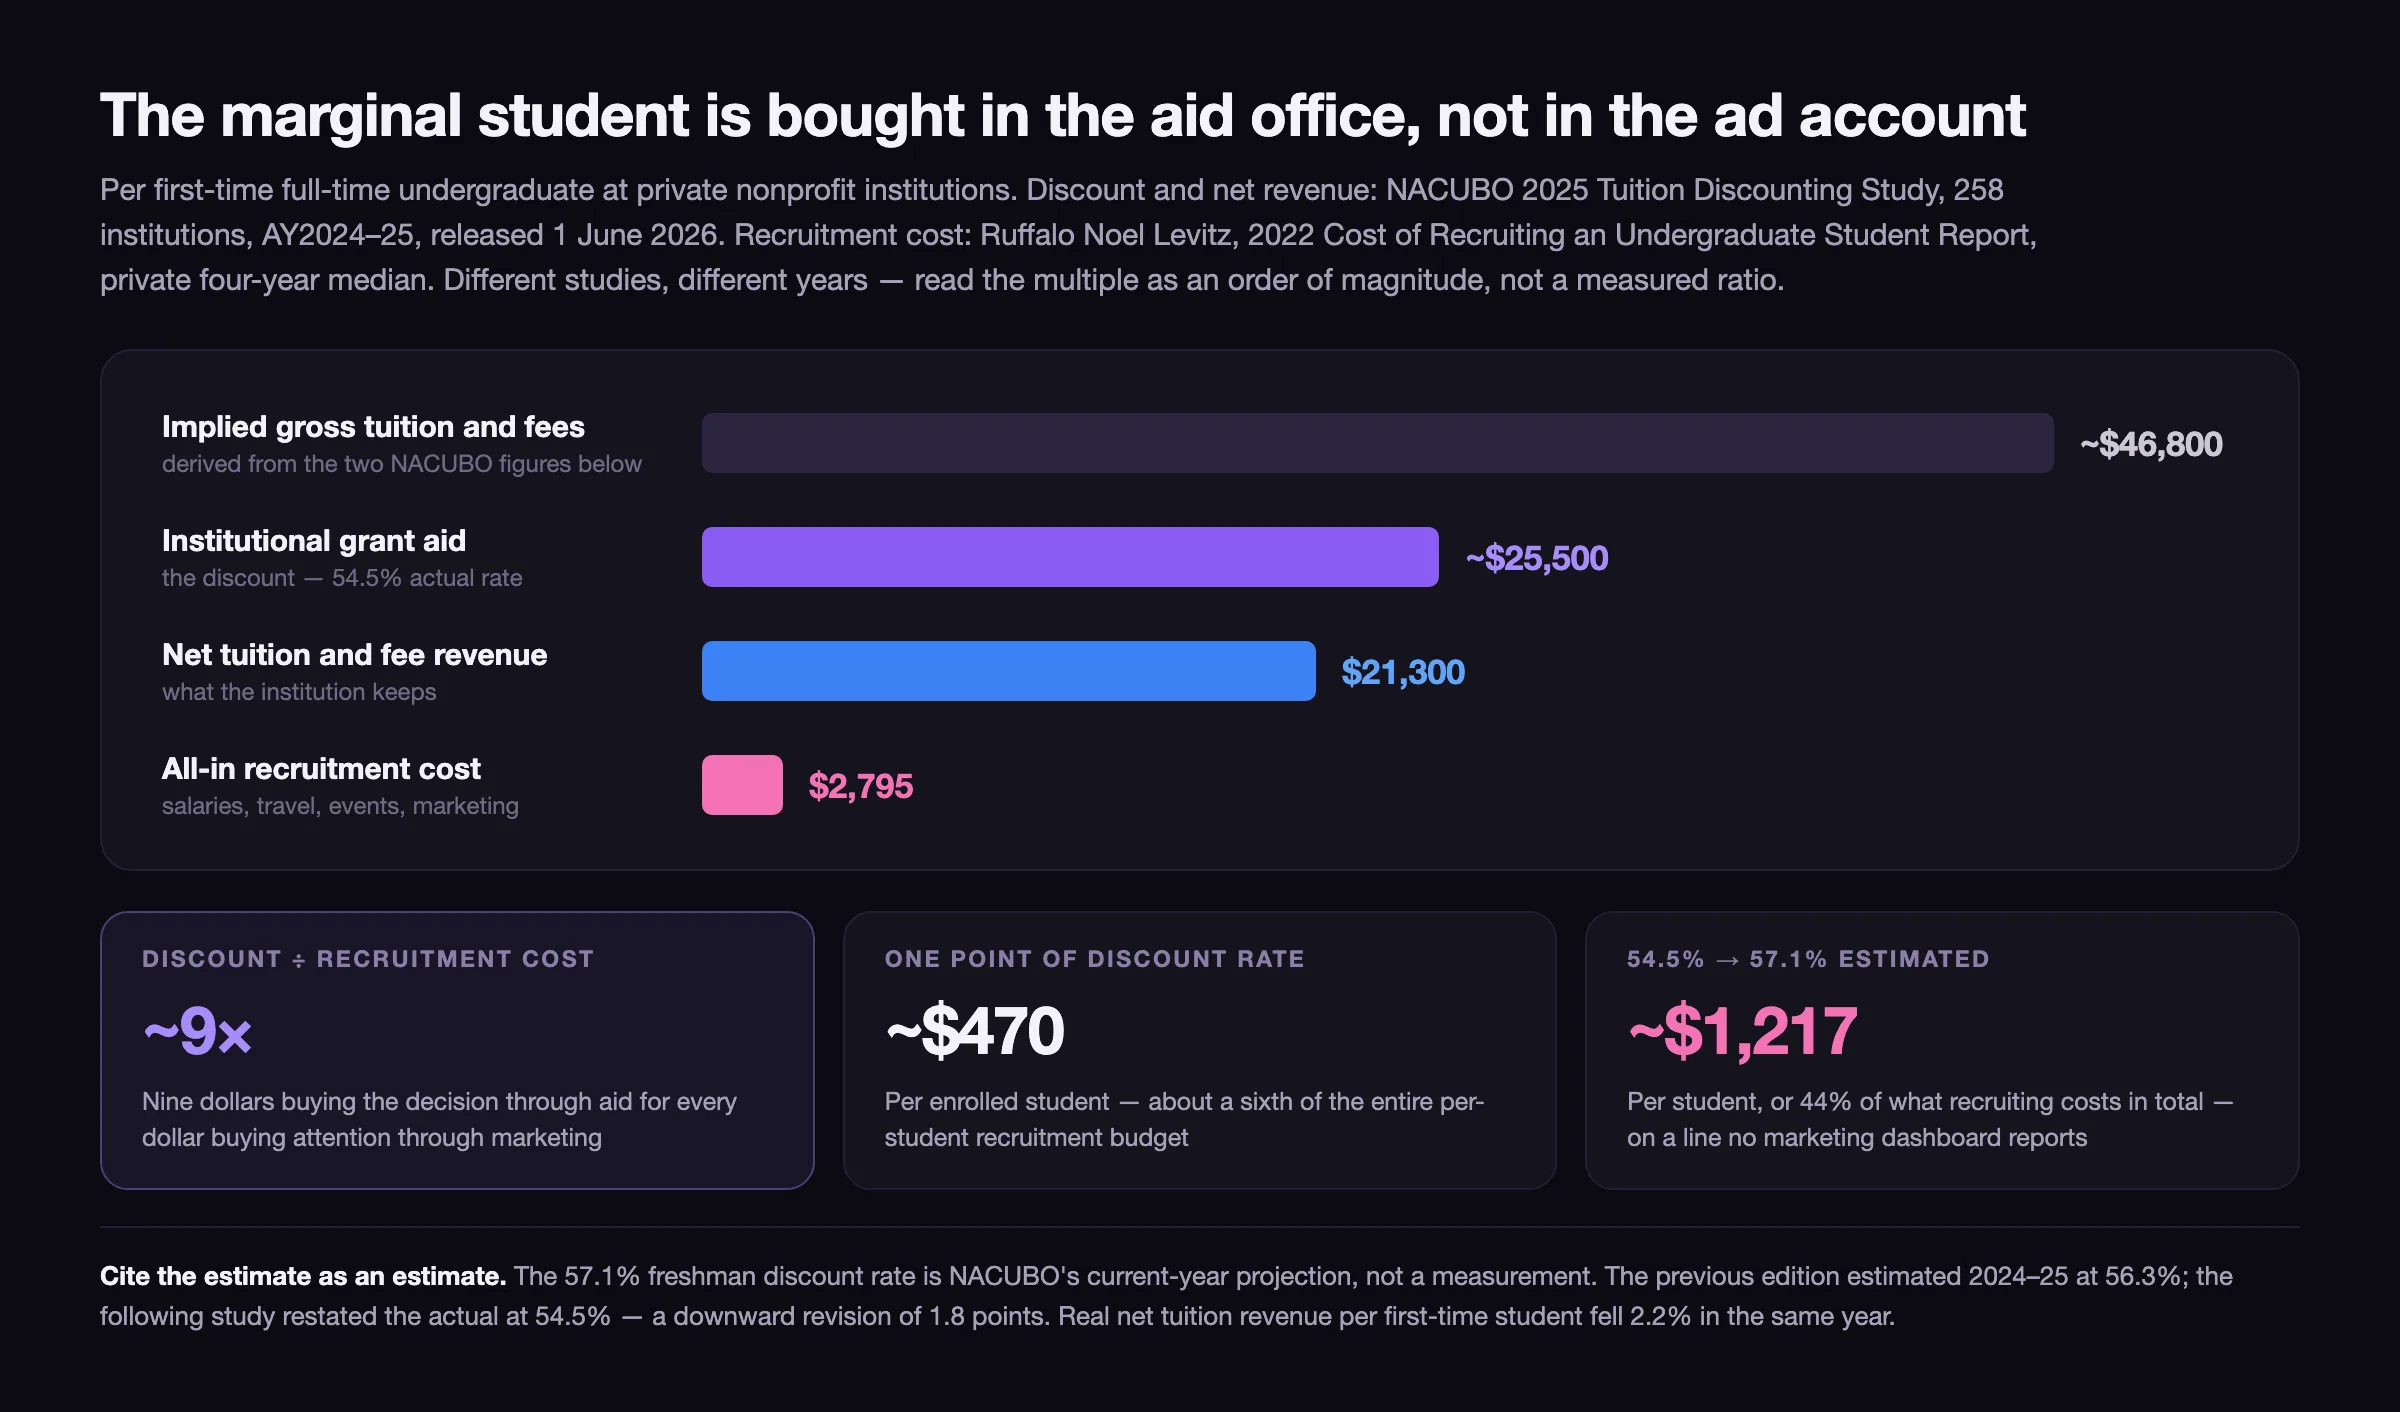
One methodological warning, because it is the kind of thing a trustee will catch. The 57.1% is an estimate for the year in progress, and NACUBO revises. Its previous edition estimated 2024–25 at 56.3% and the following study restated the actual at 54.5% — a downward revision of 1.8 points. Cite the estimate as an estimate, or cite 54.5% as the last actual, but do not present the current-year figure as measured.
The strategic consequence is the one worth arguing in a budget meeting. Widening the funnel adds students at the margin, and marginal students at greater distance and lower academic fit are the ones who need the deepest discount to enrol. The cost shows up on a line no marketing dashboard reports, at roughly nine times the scale of the line that every marketing dashboard reports. Any comparison of acquisition cost against what an enrolled student is worth over four years that omits the aid line is off by an order of magnitude, and it will recommend the wrong strategy with confidence.
The alternatives are all divisor work rather than volume work: improving inquiry-to-application, improving yield inside the existing territory, and holding the discount rate flat while the pool moves. None of them scales the way a media budget scales. All of them compound against every dollar spent above them. The specific channel mechanics for that work — what belongs in the recruitment funnel, and what each channel is actually good for — sit in our companion piece on what one enrolled student costs, which prices the funnel end to end.
What to build before the pool actually moves
The window between now and the first materially smaller graduating class is the useful part of this whole story, and it is measured in years rather than months. Four things are worth having in place before it closes, in this order.
- A weighted exposure number, recomputed annually. The two tables above take an afternoon. Recompute when your source-state mix shifts, because it will — the mix is the thing that determines whether you have a −25.1% problem or a +10.1% opportunity.
- A segment map of your own enrollment, not the national one. What share of your students are first-time traditional-age, adult, transfer, dual-enrolled, certificate-seeking, graduate and international. Each column has a different driver and a different forecast, and averaging them produces a number that describes no part of your institution.
- The discount rate on the same page as the marketing budget. They are currently reported to different committees on different cycles, which is how an institution spends a year optimising a $2,795 line while a $25,500 line moves underneath it.
- A written trigger for what you would do if the projection is wrong in either direction. It has been wrong in the near term already — in the optimistic direction, twice — and the college-going rate has more room to move than the demography does. Write down, in the annual marketing plan, which observed number would change the strategy and by how much, before anybody is emotionally committed to a forecast. That discipline is what makes our education and e-learning engagements scoped around a funnel model agreed up front rather than around a channel list.
Three caveats on everything above. WICHE’s projection is of high school graduates, not of college enrollment, and the college-going rate sits between them as a larger and more volatile term than the demography itself. The state figures use a 2023 baseline while the headline 13% uses the 2025 peak; the two are not interchangeable, and mixing them inside one calculation is the most common error in coverage of this topic. And the discount and recruitment-cost figures come from different studies, different years and different samples of a few hundred institutions each; they bound a range and sanity-check a proposal. They are not a target, and no institution should manage to a sector median it did not help produce.
08 / Reader questions
Frequently asked questions
01What is the enrollment cliff?
The enrollment cliff is the projected decline in the number of US high school graduates after a peak in 2025. WICHE's Knocking at the College Door, 11th edition, projects about 3.9 million graduates in 2025 falling to roughly 3.4 million by 2041 — 13% below the peak. WICHE publishes its state and regional figures against 2023 actuals instead, so the two baselines must not be mixed. It is a projection about 18-year-olds, not a measurement of college enrollment.
02Has the enrollment cliff started yet?
Not in the enrollment data. Freshman enrollment rose 5.5% in fall 2024 and was flat at −0.2% in fall 2025, holding at about 2.5 million, while total undergraduate enrollment rose 1.2% to 16.2 million. That is consistent with the projection rather than against it: the graduating class peaks in 2025, so the feeder population starts shrinking after that class, not before it.
03Was the reported 5% drop in freshman enrollment real?
No. It was a data error that the National Student Clearinghouse Research Center retracted on 13 January 2025. Its preliminary October 2024 report mislabelled some genuine freshmen as dual-enrolled high school students, producing a −5% figure. The corrected full-coverage estimate published later that month showed freshman enrollment up 5.5%, about 130,000 students — a ten-point swing in the opposite direction.
04Which states are hit hardest by the enrollment cliff?
Eight states are projected to lose 20% or more of their high school graduates between 2023 and 2041: Hawaii −33%, Illinois −32%, California −29%, New York −27%, West Virginia −26%, Wyoming −23%, New Mexico −21% and Michigan −20%. Twelve states and the District of Columbia are projected to grow, led by DC +31%, Tennessee +15%, South Carolina +14% and Florida +12%.
05Will the enrollment cliff make it easier to get into college?
At most institutions it already is easier, and the cliff was not the cause. The average acceptance rate at four-year non-open-admission colleges rose from 68% for fall 2019 to 73% for fall 2022, per NACAC's analysis of IPEDS data. Highly selective institutions are the exception: they draw nationally and internationally, so a domestic demographic decline barely touches their applicant pool.
06Which schools are most likely to survive the enrollment cliff?
Institutions whose enrollment does not depend on the traditional-age domestic pipeline. That means a mix of adult, transfer, dual-enrolled, certificate and graduate students, a recruitment territory weighted toward growing states, and enough endowment or state appropriation that net tuition is not the only revenue line. Small, tuition-dependent private colleges drawing one state's traditional-age graduates carry the highest exposure.