Published
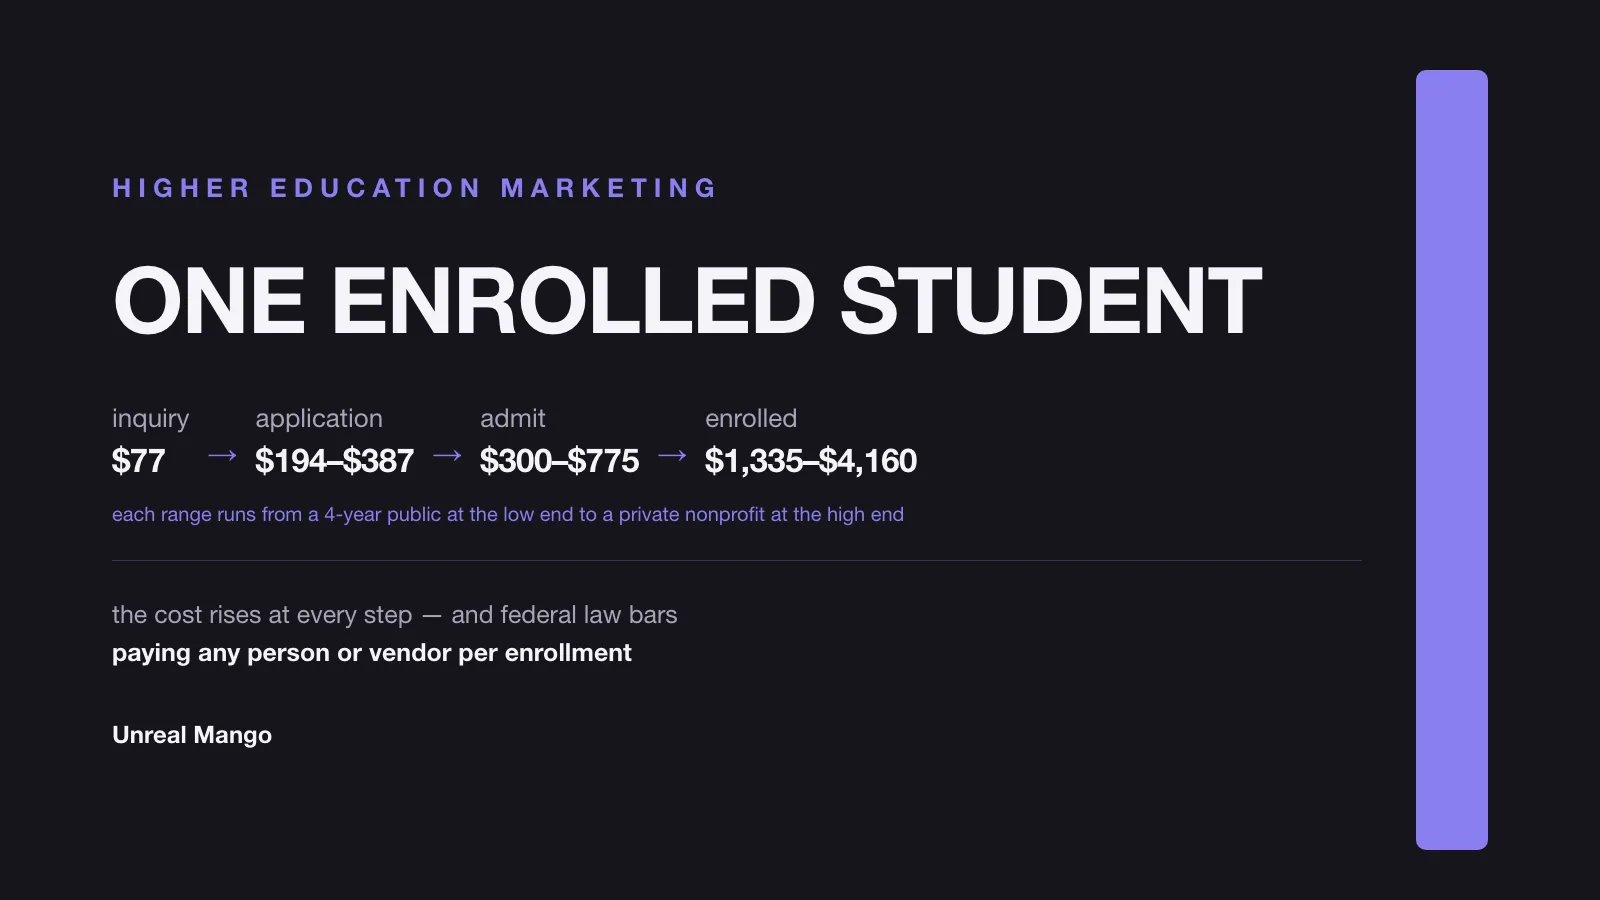
Buying the entire recruitment funnel through paid search costs roughly $1,335 to $4,160 per enrolled student — the range depends on institution type and inquiry quality, not on how good the creative is. And no institution in the federal student aid programs may pay any person or vendor per enrollment, with one narrow exception for foreign students living abroad. Both facts reshape what higher education marketing can be bought.
Two qualifiers on that headline range before anything is built on it. It is priced from the published cost-per-lead benchmark for the sector; recomputed from the same source’s click and conversion figures, the range halves to about $630 to $1,960, and the section below shows why both boundaries are defensible. And it is the marginal cost of a student bought outright through advertising, not the average cost of everyone who enrolls.
How this was checked. The funnel denominators come from the National Center for Education Statistics, Digest table 305.40, for academic year 2022–23. Media costs come from LocaliQ’s search advertising benchmarks, Education & Instruction row, last updated 1 June 2026. The regulation is quoted from the eCFR text of 34 CFR 668.14 as current on 6 August 2026, and the Department’s own guidance from Dear Colleague Letter GEN-11-05, 17 March 2011, and its published program integrity Q&A. For this query in the United States, the first organic position and the knowledge panel belong to an agency whose domain is the exact keyword; the remaining nine results are editorial strategy lists from AMA, Modern Campus, Salesforce, Foleon, OHO and EducationDynamics. None of them prices the funnel end to end, and none mentions the incentive compensation rule. That is what this page adds.
One enrolled student is three multiplications, not four stages
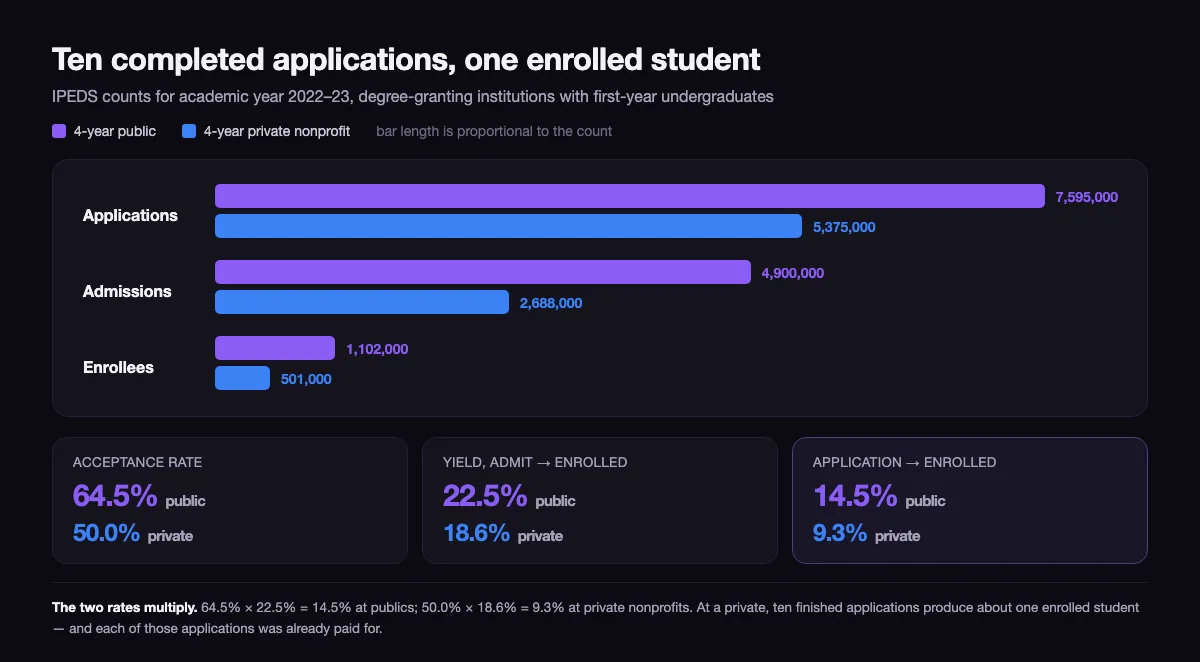
Everyone draws the funnel as a shape. The shape hides the arithmetic: each step is a fraction, and the fractions multiply. Two of the three stage rates have public, audited denominators, which means most of the funnel is not a matter of opinion.
| Step | 4-year public | 4-year private nonprofit |
|---|---|---|
| Applications | 7,595,000 | 5,375,000 |
| Admissions | 4,900,000 | 2,688,000 |
| Enrollees | 1,102,000 | 501,000 |
| Acceptance rate (application → admit) | 64.5% | 50.0% |
| Yield (admit → enrolled) | 22.5% | 18.6% |
| Application → enrolled | 14.5% | 9.3% |
Source: NCES Digest of Education Statistics, table 305.40, academic year 2022–23, degree-granting institutions with first-year undergraduates. Rates are computed from the published counts.
Read the bottom row slowly, because it is the number that prices everything above it. At a four-year private nonprofit, ten completed applications produce roughly one enrolled student. Not ten inquiries, not ten leads — ten finished applications, each of which already survived whatever the institution spent to generate it.
The first step, inquiry to application, has no equivalent public denominator, and that is not an oversight in the data. Institutions define an inquiry differently: a form fill, a test-score send, an event registration, a purchased name from a search service. The benchmarks that do exist for it sit behind vendor paywalls and are self-reported. So the honest treatment is to leave it as a variable and price the funnel across a range of it, which is what the next section does.
What one enrolled student costs when the whole funnel is bought
Start from a published media cost. LocaliQ’s 2026 search advertising benchmarks put the Education & Instruction category at $4.81 average cost per click, 7.56% click-through rate, 13.14% conversion rate and $77.48 average cost per lead, drawn from thousands of Google Ads and Microsoft Ads accounts.
Feed that into the multiplications above at three different inquiry-to-application rates:
| Inquiry → application | Cost per application | Cost per enrolled, public | Cost per enrolled, private nonprofit |
|---|---|---|---|
| 20% | $387 | $2,670 | $4,160 |
| 30% | $258 | $1,780 | $2,770 |
| 40% | $194 | $1,335 | $2,080 |
Each cell is $77.48 divided by the inquiry-to-application rate, then divided by the application-to-enrolled rate from the previous table.
The only published figure to check this against is an average, not a marginal cost, so the comparison has to be made carefully. RNL’s 2022 Cost of Recruiting an Undergraduate Student Report — a poll taken at the end of 2021 covering the 2020–21 budget year, with 59 nonprofit four-year institutions responding — found a median all-in cost of $2,795 per enrolled student at privates and $494 at publics. That is the whole recruiting budget divided by every enrollee, including the ones no campaign ever touched.
The private figure lands almost exactly on the 30% row above. That is a coincidence rather than a validation, and it is worth saying so plainly: an average and a marginal cost are not the same quantity, and they can only converge when nearly every enrollee was in fact bought. What the two columns show together is how much of each sector’s intake is purchased at all.
At publics, most of it is not. A modelled $1,335 to $2,670 against a reported $494 is a 2.7× to 5.4× difference. The explanation is not cheaper media. It is that in-state pipelines, transfer flows, brand recognition and high school relationships deliver students at a marginal cost close to zero, and dividing the whole budget by all of them produces a small average. Treating the $494 as a target for a paid campaign is how enrollment budgets get set to fail. At privates the gap closes because a much larger share of the class is genuinely competed for — which is the finding, not the coincidence of the two numbers matching.
One correction belongs here, because it moves every figure in the table. LocaliQ’s own row is internally inconsistent: $4.81 per click at a 13.14% conversion rate implies $36.61 per lead, not $77.48. The published CPL is 2.1 times higher, which is what happens when category averages are computed across accounts rather than as total spend over total leads. Recomputed from the derived $36.61, cost per enrolled at a private nonprofit runs $980 to $1,960, and at a public $630 to $1,260. Either boundary is defensible; quoting a single point estimate from that benchmark is not, and the same arithmetic trap sits underneath every published cost-per-click average.
Applications per applicant: the 6.80 that flattens application KPIs
Common App’s end-of-season report for 2024–25, published 13 August 2025, counted 1,498,199 distinct first-year applicants filing 10,193,579 applications — 6.80 applications each, up from 6.64 the prior season and up 46% over ten years.
That number is why cost per application is a weak KPI in this vertical and a dangerous one in a vendor contract. When you pay for an application, you are acquiring roughly one-seventh of a decision. The applicant is simultaneously an applicant at five or six competitors, most of whom will also admit them.
Multiple applications explain part of the low yield, but not all of it, and the difference matters when someone tries to argue the yield is a marketing failure. At 6.80 applications and a 50% acceptance rate an applicant holds about 3.4 offers, which alone would put yield near 29%. The observed 18.6% needs about 5.4 offers per enrolled student — and the IPEDS table above says exactly that: 5,375,000 applications against 501,000 enrollees is 10.7 applications per enrolled student at private nonprofits, not 6.80. The gap between the two figures is applications filed outside the Common App, applicants who enroll at a public instead, and applicants who enroll nowhere. Both numbers point the same way; the sector-level one is the larger of the two.
It also explains why the two halves of the funnel respond to completely different work. Everything left of the application responds to media, targeting and offer clarity — the standard levers. Everything right of it responds to speed of response, financial aid packaging, campus visits and the quality of the admitted-student experience, none of which an advertising budget touches. Institutions that push more money at the top of a funnel with a yield problem raise their cost per enrolled student while their dashboards show improvement, which is the same failure mode as treating every lead as equally qualified.
Stealth applicants make the top half harder to measure at the same time. EducationDynamics’ 2026 benchmarks report, published 6 January 2026, puts applicants who never appeared as an inquiry first at 9.7% of total applications, up from about 1% in 2020. Roughly one application in ten now has no traceable inquiry attached to it, which inflates the measured inquiry-to-application rate for everyone who divides applications by known inquiries.
Federal law bans paying anyone per enrolled student
This is the constraint that separates higher education from every other vertical with a long sales cycle, and it is almost absent from the published strategy guides.
Under 34 CFR 668.14(b)(22)(i), an institution entering a program participation agreement for federal student aid agrees not to provide “any commission, bonus, or other incentive payment based in any part, directly or indirectly, upon success in securing enrollments or the award of financial aid” to any person or entity engaged in student recruitment or admission activity, or in making decisions regarding the award of Title IV, HEA program funds. The statutory basis is 20 U.S.C. § 1094(a)(20). The regulation was last amended at 88 FR 74696, published 31 October 2023 and effective 1 July 2024; the text below is the eCFR version current as of 6 August 2026.
Four definitions in paragraph (b)(22)(iii) do the real work, and the third is the one this article turns on:
- (A) “Commission, bonus, or other incentive payment” means “a sum of money or something of value, other than a fixed salary or wages, paid to or given to a person or an entity for services rendered.” Those three words are why this is a marketing problem and not only an HR problem: an agency is an entity.
- (B) “Securing enrollments or the award of financial aid” covers activities engaged in for the purpose of the admission or matriculation of students or the award of financial aid, and it names prospective-student contact specifically — preadmission or advising activities, scheduling and attending an appointment at an institutional office, involvement in the signing of an enrollment agreement or financial aid application.
- (C) The covered population reaches past employees to any institution or organization that undertakes the recruiting or admitting of students.
- (D) “Enrollment” means “the admission or matriculation of a student into an eligible institution.” Paying on matriculation and paying on admission are the same violation.
Definition (B) also carries the sector’s only written safe harbour, and it is narrow enough to quote in full effect: paying a third party for the provision of student contact information is outside the definition, provided the payment is not based on any additional conduct by the vendor or the prospective student — the advising, appointment and signing activities listed above — and not based on the number of students who apply for enrollment, are awarded financial aid, or enroll. That single sentence is the legal basis for per-lead pricing in this vertical, and the reason a per-application fee is a different animal from a per-lead one.
Two exceptions and one anti-avoidance rule sit alongside it. Paragraph (b)(22)(i)(A) removes from the ban the recruitment of foreign students residing in foreign countries who are not eligible to receive Federal student assistance — the only carve-out of its kind, and the reason overseas agent commissions are lawful for one population and unlawful for another. Paragraph (b)(22)(ii) preserves merit-based adjustments to employee compensation unrelated to enrollment or aid success, and profit-sharing payments to people not engaged in recruitment, admission or aid decisions. And (b)(22)(i)(B) closes the obvious workaround: multiple compensation adjustments inside a single calendar year to someone in an enrollment or aid role are treated as enrollment-based if their combined effect is compensation tied to that success.
Enforcement is not theoretical, and it is current. On 24 February 2026 the Department of Justice announced that Study Across the Pond LLC and co-founder John Borhaug would pay $1.3 million to resolve False Claims Act allegations. The firm had recruited US students eligible for federal loans into UK universities since 2013 and, in the Justice Department’s words, “demanded a commission for its recruitment services, which was a share of the tuition paid by any students the company recruited for the schools.” The whistleblower’s share was $240,500. Note what made the foreign-student carve-out unavailable: the students were US residents eligible for federal aid, so recruiting them into an overseas institution sat inside the ban rather than outside it. The claims were resolved by settlement, with no determination of liability, and the case arrived through a qui tam relator rather than a Department audit — which is the part worth internalising when reviewing a vendor contract.
Nothing here is legal advice. A contract this rule touches should be read by counsel who works in Title IV compliance, not by a marketing team with a regulation open in a browser tab.
Where the Department draws the line between advertising and recruitment
The ban does not outlaw performance marketing. It draws a line through it, and the Department has published where the line sits — in guidance accompanying the program integrity regulations, activity is sorted into several categories rather than a simple pair.
| Covered by the ban | Exempt |
|---|---|
| Recruitment activities: targeted information dissemination to individuals; solicitations to individuals; contacting potential enrollment applicants; aiding students in filling out enrollment application information | Marketing activities: broad information dissemination; advertising programs that disseminate information to groups of potential students; collecting contact information |
| Services related to securing financial aid, including completing financial aid applications on behalf of prospective applicants | Screening pre-enrollment information to determine whether a prospective student meets the institution’s requirements for enrollment in an academic program |
| Policy decisions by senior executives and managers about how recruitment, enrollment or financial aid will be pursued | Determining whether an enrollment application is materially complete, as long as the enrollment decision remains with the institution |
| Student support services offered after aid disbursement for a payment period — general, career, financial aid, online and academic support |
Two things decide which side an arrangement falls on, and either one alone is enough to bring it inside the ban. The first is individualised contact with a named prospective student: a vendor that runs campaigns to audiences and hands over contact details is doing exempt work, while the same vendor whose staff start calling those people to move them toward an application is doing recruitment. The second is the measure the payment is calculated on — the safe harbour in definition (B) falls away the moment the fee is based on how many students apply, are awarded aid, or enroll, however hands-off the vendor is.
The right-hand column is wider than most institutions assume, and the two lower rows are the reason. Screening a prospect against published program requirements, and checking whether an application is materially complete, are both exempt as long as the decision itself stays with the institution — which covers a great deal of what a modern enrollment-marketing vendor actually does.
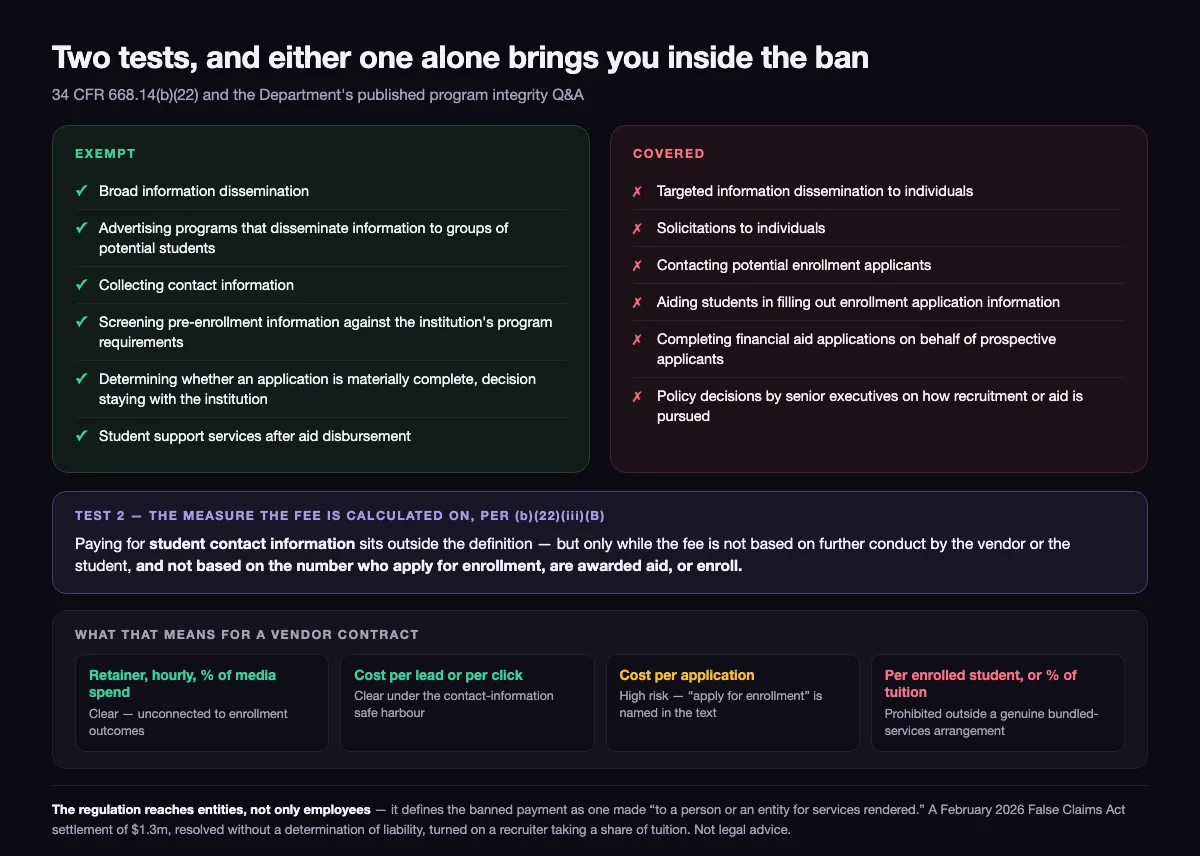
This is why per-lead pricing survives in this vertical while per-enrollment pricing does not. A lead is contact information, bought under an express safe harbour. An enrollment is the outcome the regulation names.
Per-application pricing is the one people get wrong, and it is closer to settled than it looks. Definition (B) disqualifies the contact-information safe harbour where the payment is based on the number of students who apply for enrollment — the phrase is in the text, alongside aid awards and enrollments. A fee that scales with applications therefore sits outside the safe harbour on the payment measure alone, before anyone asks what the vendor’s staff do on the phone. Treat it as prohibited unless counsel who works in Title IV says otherwise about a specific contract, rather than as a grey area to be negotiated.
Measurement is affected as much as payment. If the vendor cannot be paid on enrollments, the enrollment still has to be attributed back to the campaign for anyone to know what worked. That means importing enrolled-student outcomes as offline conversions rather than optimising to form fills, which is a plumbing job — server-side conversion tracking — with the compensation deliberately left out of it.
The bundled services exception, and why it rarely covers an agency
The standard objection at this point is that online program managers plainly are paid a share of tuition. They are, under a specific 2011 exception that is narrower than its reputation.
Dear Colleague Letter GEN-11-05, dated 17 March 2011, addresses a third party providing a set of bundled services. Its Example 2-B states that an institution “may pay the entity an amount based on tuition generated for the institution by the entity’s activities for all bundled services that are offered and provided collectively, as long as the entity does not make prohibited compensation payments to its employees, and the institution does not pay the entity separately for student recruitment services provided by the entity.”
Five conditions are doing the work in that sentence, and a marketing agency typically fails at least three:
- Unaffiliated. The entity must not be affiliated with the institution it serves, nor with any other institution providing educational services.
- Bundled and collective. The services are offered and provided together — course development, technology, student support, marketing — not recruitment sold on its own with other line items attached for cover.
- Tuition generated, not enrollments counted. The payment is measured against tuition arising from the bundle’s activities as a whole.
- Clean downstream. The entity must not pay its own recruiters on enrollment success, which is exactly what a revenue share tempts it to do.
- No separate recruitment line. The institution must not pay the entity separately for student recruitment services. A retainer for media plus a revenue share described as covering recruitment is the arrangement this clause was written to stop.
An agency selling media buying, creative and campaign management is not providing a bundle in this sense, and a revenue-share arrangement dressed as one is the fact pattern the Department’s own review is aimed at. On the status of that review, the honest summary is that it stalled. The Department announced listening sessions in February 2023 and received over 250 comments; Under Secretary James Kvaal said in July 2024 that revised guidance would come “no sooner than late this year.” It never issued, and the administration has since changed. As of this writing the exception stands — reviewed since 2023, never replaced — which is a different risk profile from a settled rule, and one worth pricing into the termination clause of any multi-year contract built on it.
Contract shapes that survive the incentive compensation ban
Working backwards from the rule, the available structures sort cleanly.
| Structure | Status | Why |
|---|---|---|
| Monthly retainer, fixed scope | Clear | Fixed fee for services, unconnected to enrollment outcomes |
| Hourly or project fee | Clear | Same |
| Percentage of media spend | Clear | Varies with budget, not with enrollments |
| Cost per lead or per click, no individual outreach by the vendor | Clear | Expressly outside the definition under (b)(22)(iii)(B) when the fee is not tied to applications, aid or enrollments |
| Cost per application | High risk — treat as prohibited absent counsel | (b)(22)(iii)(B) removes the safe harbour where payment is based on the number who “apply for enrollment” |
| Bonus for hitting an enrollment target | Prohibited | Incentive payment based on success in securing enrollments |
| Percentage of tuition, marketing services only | Prohibited outside a genuine bundle | Fails the bundled services conditions; the fact pattern alleged in the SATP settlement |
| Any per-enrolled-student fee | Prohibited | The outcome the regulation names directly |
| Commission for recruiting foreign students abroad who are not Title IV eligible | Outside the ban | The express carve-out in (b)(22)(i)(A) — and it does not extend to US-resident students |
The practical effect on budgeting is that higher education cannot buy enrollment risk transfer. In most verticals a client can push performance risk onto a vendor by paying only for outcomes. Here the outcome payment is illegal, so the institution keeps the risk and pays for work — which makes the diagnostic quality of the work, rather than the pricing model, the thing actually being selected. That is the whole reason our education and e-learning engagements are scoped as retainers with the funnel model agreed up front rather than as a share of anything.
It also means the contract needs a definition of the deliverable that the payment does not smuggle enrollment into. A retainer with a clause promising a fee adjustment “if enrollment targets are met” is a bonus based on securing enrollments wearing a different noun, and the regulation’s “in any part, directly or indirectly” language is written to catch exactly that.
The 2025 graduate peak makes every number above worse
WICHE’s 11th edition of Knocking at the College Door, published December 2024, projects that US high school graduates peak in 2025 at between 3.8 and 3.9 million — the highest on record — then decline steadily to below 3.4 million by 2041, about 13% fewer.
The consequence for the arithmetic is direct. Institutional enrollment targets are not falling 13%, so a shrinking pool is being pursued by the same number of recruiters with the same or larger goals. How much of that 13% actually reaches a given institution is a separate calculation, and the spread between institutions is far wider than the national figure suggests — worked through in how much of your enrollment is actually exposed to the cliff. That pushes competition into the auction, and the auction is already moving: EducationDynamics reports non-brand paid search CPCs up 30.9% year over year, against total digital media spend in the sector surpassing $2.77 billion in 2025.
Rising CPC and a flat conversion chain multiply. Carry that 30.9% across to the cost per lead — the two figures come from different vendors’ samples, so this is an illustration of direction rather than a measured CPL increase — and the private nonprofit 30% row moves from $2,770 to about $3,600 per enrolled student, with nothing about the institution having changed. The two defences available are both on the right-hand side of the funnel — improving yield, and improving inquiry-to-application — because those are divisors, and a divisor improvement compounds against every dollar spent above it. Moving inquiry-to-application from 20% to 30% cuts cost per enrolled by a third; no creative refresh does that.
The search surface is shifting underneath at the same time. EducationDynamics estimates that around 78% of education-related searches now return an AI Overview, against nearly 45% of Google searches overall ending without a click, while nearly 60% of online learners begin with a search for a specific institution — a 354% rise in brand-first searching since 2015. A funnel that assumes the first touch is a click on a non-brand ad is measuring a smaller share of reality each year.
Four numbers worth putting on an enrollment dashboard
Most enrollment dashboards report volume at each stage. Volume tells you what happened; ratios tell you what to change. These four, tracked by source, are the minimum set that supports a decision.
- Inquiry-to-application, by source. The only stage rate you fully control and the one with the largest leverage on cost per enrolled. Track it by acquisition source, because a purchased name list and an organic campus-visit registration converting at the same headline rate almost never behave the same downstream.
- Cost per enrolled student, by source, marginal not average. Divide the spend on a channel by the enrollees attributable to that channel, not by all enrollees. The $494-versus-$2,670 gap earlier in this page is what happens when the two are mixed.
- Yield by admitted-student segment. In-state against out-of-state, aided against unaided, visited against not visited. Aggregate yield is a blended number that hides the segments where marketing money would actually move something.
- Share of applications with no prior inquiry. The stealth share is now near a tenth of applications and rising. Without it, every inquiry-based ratio on the dashboard is quietly overstated.
The reporting cadence matters more here than in most verticals because the cycle is annual. A channel decision made in March cannot be evaluated until the following autumn’s census date, which means the intermediate ratios above are the only steering available for most of the year — and it is worth writing down, in the annual marketing plan, which ratio would have to move by how much for a channel to be kept. Email is usually the cheapest lever inside the cycle, and the metric to watch there is not the one most institutions report, for reasons covered in what a good open rate actually means now.
Three closing caveats on the numbers in this article. The IPEDS denominators are 2022–23 and describe sector aggregates, not any single institution: a selective private with a 30% yield and a regional public with a 40% one both sit inside those averages and will price out very differently. The media benchmarks are cross-account averages from one vendor’s client base in a broad “Education & Instruction” category that mixes universities with tutoring and vocational training. And the RNL medians rest on a small sample — 59 institutions in total, split into 35 privates and 24 publics — drawn from a pandemic-affected budget year. Use all of it to bound a range and to sanity-check a proposal. Do not use any of it as a target.
10 / Reader questions
Frequently asked questions
01How much does it cost to recruit one enrolled student?
Buying the whole funnel through paid search costs roughly $1,335 to $4,160 per enrolled student, depending on institution type and how many inquiries turn into applications. That is a marginal cost. RNL's 2022 benchmark divides all recruiting spend by all enrollees instead, giving a median $2,795 at private four-year institutions and $494 at publics — far below the modelled range at publics, because most of their enrollees are never bought through advertising at all.
02Can a college pay a marketing agency per enrolled student?
No. 34 CFR 668.14(b)(22)(i) bars any institution in the federal student aid programs from paying a commission, bonus or other incentive payment based in any part, directly or indirectly, on success in securing enrollments. The regulation defines the payment as going to a person or an entity, so vendors are covered, not just staff. The single exception is the recruitment of foreign students residing abroad who are not eligible for federal student assistance.
03What is the bundled services exception?
A 2011 Department of Education Dear Colleague Letter, GEN-11-05, allows an institution to pay an unaffiliated third party an amount based on tuition generated when that party provides a bundle of services collectively — as long as the entity does not make prohibited compensation payments to its employees, and the institution does not pay it separately for student recruitment services. The Department opened a formal review in February 2023; revised guidance was promised for late 2024 and never issued, so the exception still stands.
04Is paying an agency per lead allowed in higher education?
Generally yes, and the basis is in the regulation itself rather than in guidance. 34 CFR 668.14(b)(22)(iii)(B) puts payment to a third party for the provision of student contact information outside the definition of securing enrollments, provided the payment is not based on further conduct by the vendor or the student, and not based on the number of students who apply for enrollment, are awarded financial aid, or enroll. A per-lead fee that meets both conditions is outside the ban; a per-application fee is not.
05What is a good inquiry-to-enrollment conversion rate?
There is no single benchmark, because the inquiry stage has no standard definition. The two later steps do: IPEDS data for 2022–23 puts the application-to-enrollment rate at 9.3% for four-year private nonprofits and 14.5% for four-year publics. Anything a vendor quotes above that for the whole funnel is measuring a narrower stage than it appears to be.
06Why is enrollment marketing getting more expensive?
Two forces at once. The number of US high school graduates peaks in 2025 at between 3.8 and 3.9 million and is projected to fall about 13% by 2041, so the pool shrinks while institutions keep their targets. And applicants now file 6.80 Common App applications each, so every application you win is competing with five or six other applications from the same student.