Published
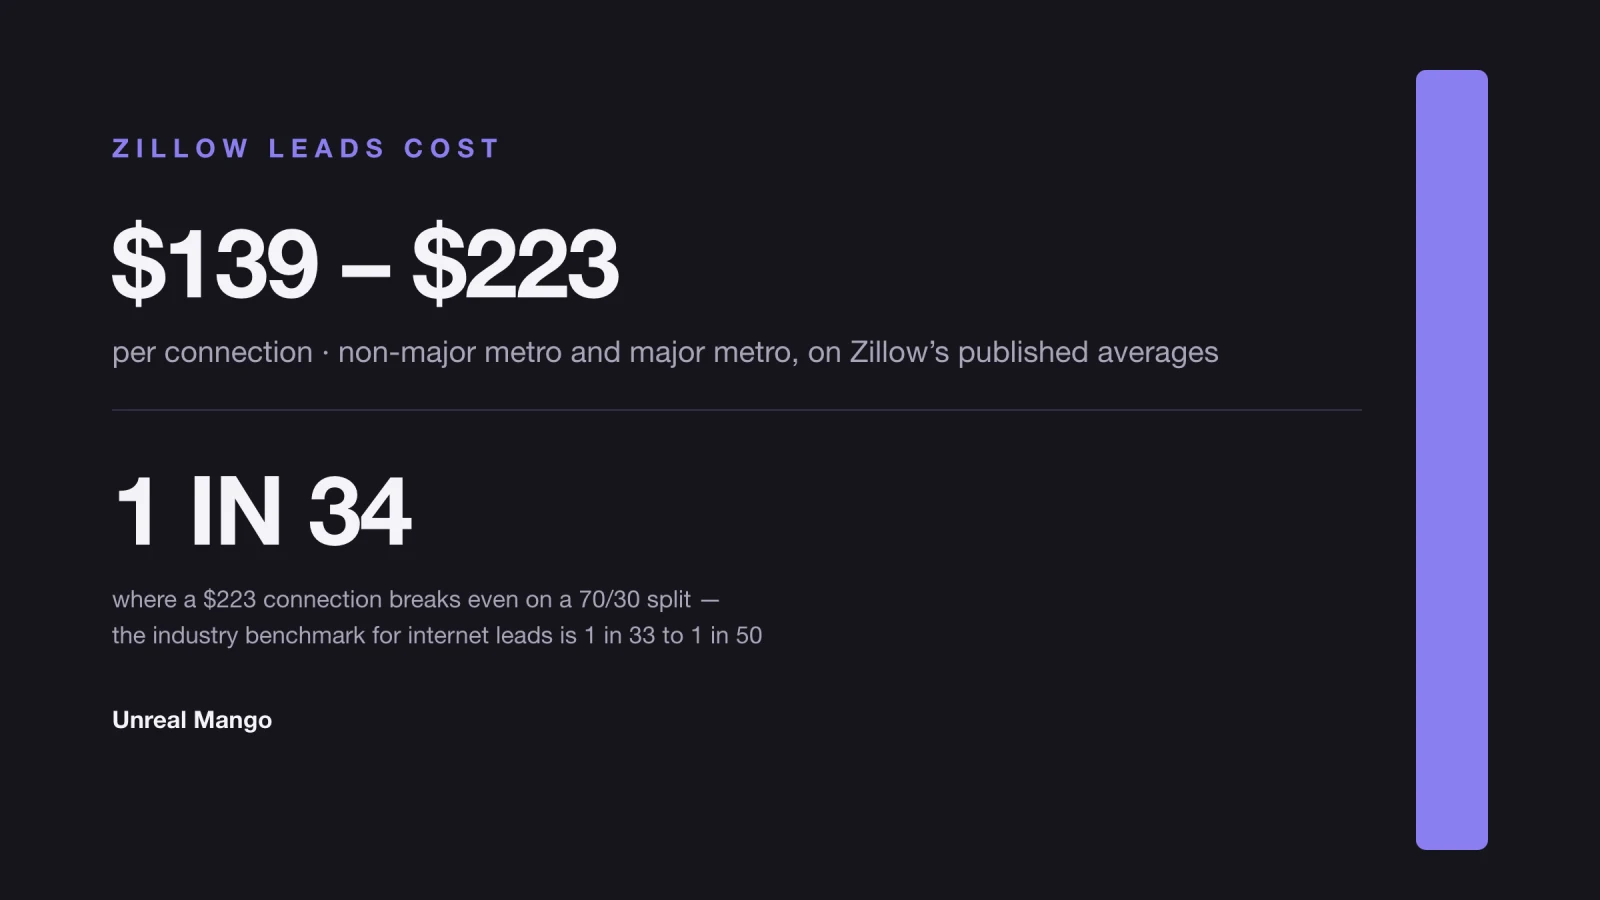
Zillow leads cost $139 to $223 per connection in 2026 — $223 in major metro areas and $139 outside them, on Zillow’s own published averages. Third-party reporting puts the resulting monthly spend at $300–500 in non-metro areas and $1,000 or more in metro ones. The price is set by ZIP code, not by lead.
That last sentence is the whole subject. Search results for this question hand back two price bands that contradict each other — $20–60 per lead in one, $139–223 per connection in another — and neither explains the mechanism that produces them. This piece prices the product in the units Zillow actually sells it in, then works out the one number that decides whether the price is good: the conversion rate at which it breaks even.
Zillow lead prices in 2026: $139 to $223 per connection
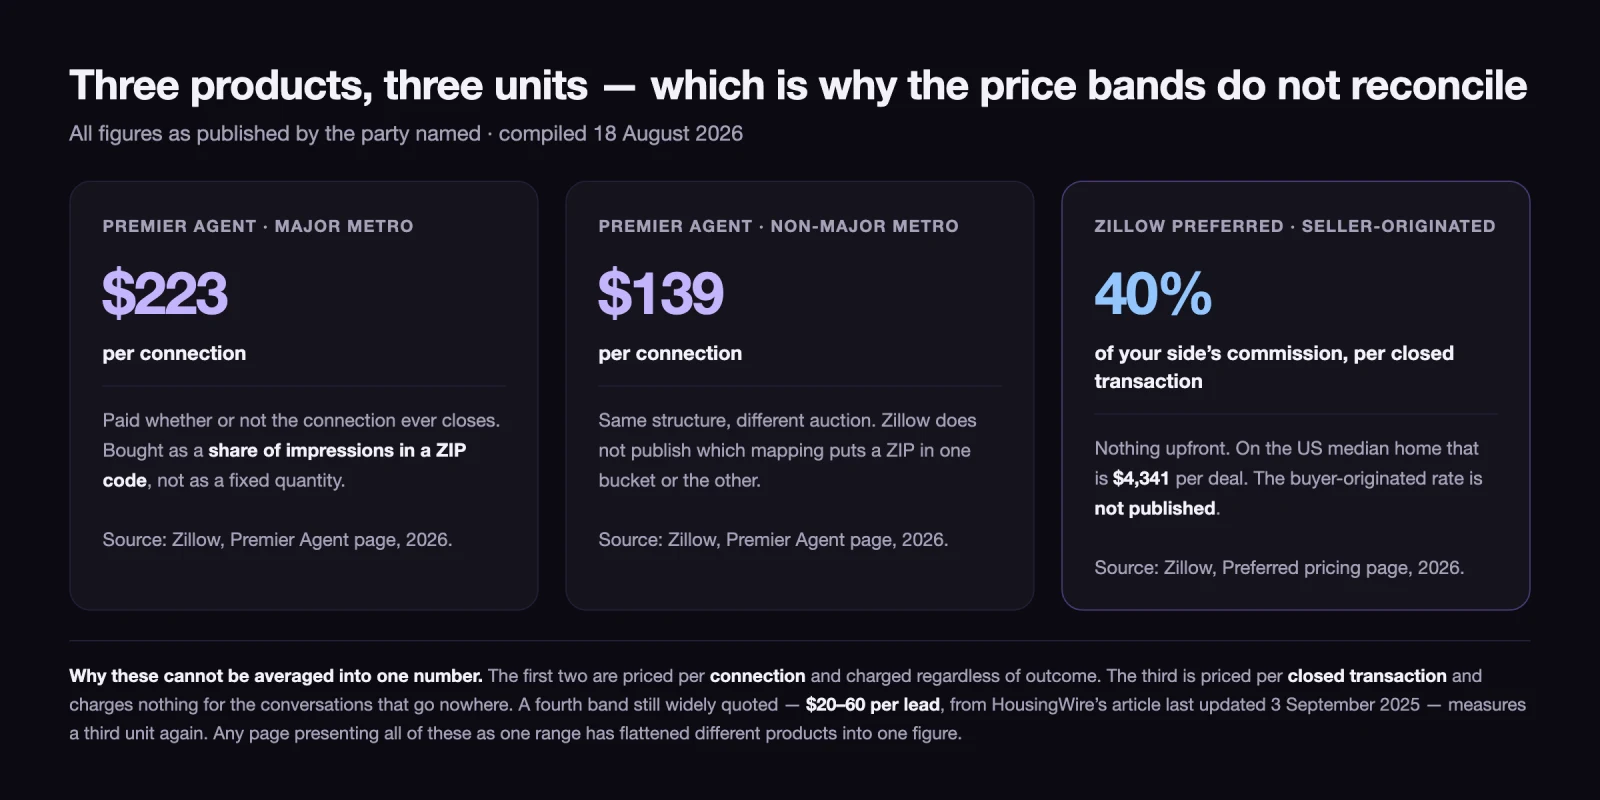
Every figure below is attributed to the party that published it. Zillow’s rows are its own published averages; HousingWire’s are reported estimates from an outlet that says plainly Zillow will not quote publicly. None of them is a sales quote to you.
| What you are paying for | Price | Unit | Source and date |
|---|---|---|---|
| Premier Agent connection, major metro | $223 | per connection | Zillow, Premier Agent page, 2026 |
| Premier Agent connection, non-major metro | $139 | per connection | Zillow, Premier Agent page, 2026 |
| Monthly spend, non-metro areas | $300–500 | per month | HousingWire, updated Sept 2025 |
| Monthly spend, metro areas | $1,000+ | per month | HousingWire, updated Sept 2025 |
| Per-lead band still widely quoted | $20–60 | per lead | HousingWire, updated Sept 2025 |
| Zillow Preferred, seller-originated | 40% of your side’s commission | per closed transaction | Zillow, Preferred pricing page, 2026 |
| Zillow Preferred, buyer-originated | not published | per closed transaction | Zillow, Preferred pricing page, 2026 |
Method. The two Zillow rows come from Zillow’s own Premier Agent and Preferred pricing pages as published in 2026. The HousingWire rows come from an article last updated 3 September 2025, which states plainly that Zillow does not publish exact pricing. The rows measure different units: Zillow reports its own average in connections, HousingWire’s older band is quoted per lead, and the Preferred row is a share of a commission with no upfront charge at all. They do not reconcile into a single number, and any page that presents them as one range has flattened three different products.
The contract term matters as much as the rate, and it is optional. Zillow states that “contracts are not required, but there are benefits to signing a contract like discounts and prioritized access to new inventory,” and that it offers six-month terms “as that is the minimum recommendation of time to see the most value out of your Zillow investment.” Take the discount and, at the metro figure, six months at $1,000 is a $6,000 commitment made before you have a single data point on how the ZIP converts for you. That is the trade the discount is buying.
You are buying share of voice in a ZIP code, not a lead
Zillow explains the mechanism on its own agent-resources page, and the explanation is more useful than any price table.
Advertising is sold by ZIP code. The base cost varies by market, “with high-demand ZIP codes being more expensive than those with less demand,” and the price “is driven by market demand in each ZIP code. The more agents who participate and buy advertising in a ZIP code, the higher the price.”
Visibility is then split in proportion to spend. Zillow’s worked example: three agents each spending $100 receive equal prominence. If one raises spend to $400, that agent holds 200% share of voice and the other two drop to 50% each.
Read that carefully, because it defines the product. You are not buying a fixed quantity of leads at a fixed unit price. You are buying a proportion of the impressions that the ZIP code happens to generate that month. Two things follow, and both are consequences of the design rather than criticisms of it:
- Your unit cost is not under your control. If a competitor raises spend, your share falls and your effective cost per connection rises without your budget changing.
- Your volume is not under your control either. Share of a quiet month is fewer connections for the same money. The $223 average is an average across markets and months, not a rate you are charged.
This is a perfectly coherent way to sell attention — it is how search advertising works too. It is simply not the same thing as buying leads, and a spreadsheet that treats it as a per-unit purchase will be wrong in both directions.
Two adjacent ZIP codes, two prices for the same lead
HousingWire lists four inputs to the base cost: the chosen ZIP code, average home values, the number of competing agents, and overall market demand. Zillow compresses the same thing to two — market and competition. Either way, one input is about the buyer and the rest are about the auction.
That is why two ZIP codes across a road from each other, with the same housing stock and the same schools, can carry very different prices. The houses are comparable; the number of agents bidding is not. Price follows competitor density more visibly than it follows anything about lead quality.
There is a second, quieter point about geography. Zillow’s Preferred pricing page states that it “relies on public data for zip code to market mapping, which updates over time and is subject to change without notice.” That sentence governs the Preferred success fee rather than the Premier Agent averages, and Zillow does not publish which mapping produces the major-metro and non-major-metro split behind $223 and $139. What it does establish is that the boundary between one pricing bucket and the next is drawn from public data, on Zillow’s schedule rather than yours.
The practical consequence: price a portal at ZIP level, never at market level. The right unit of analysis is one ZIP code over one contract term, and the neighbouring ZIP is a genuinely different product at a genuinely different price.
One in 34: the conversion rate that pays for a $223 connection
Here is the number nobody publishes, because it requires committing to an arithmetic rather than a range.
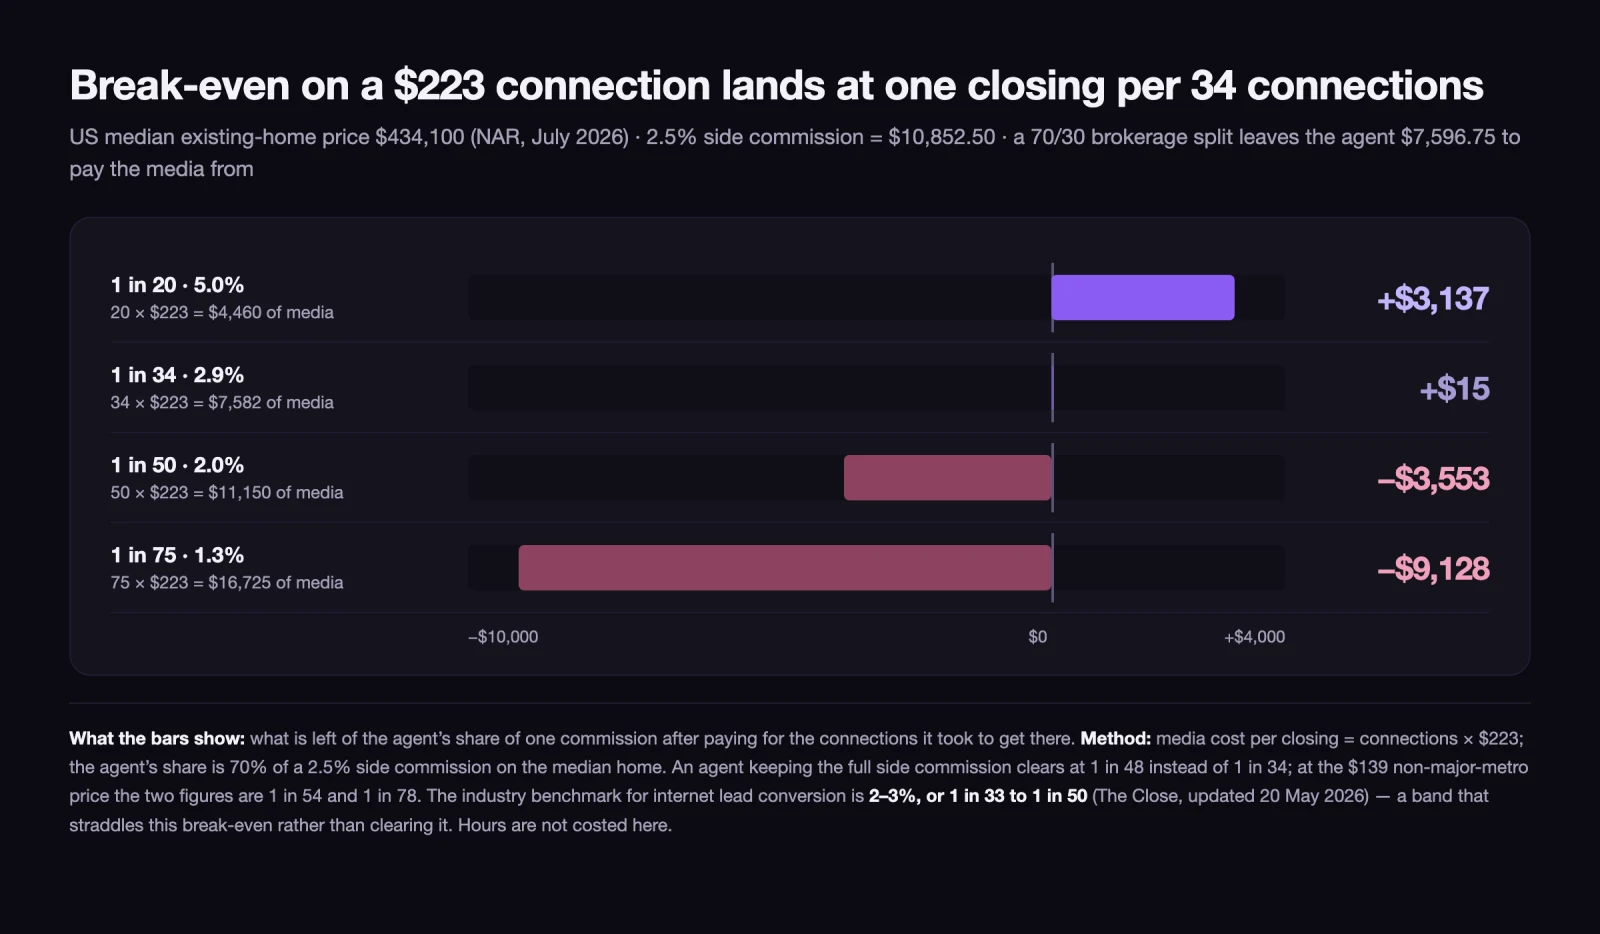
Start from what a closing is worth. NAR’s July 2026 report, released 11 August 2026, puts the median existing-home price at $434,100. Take a deliberately conservative 2.5% for one side of the transaction — Clever’s February 2026 survey of 533 agents found the buyer’s side averaging 2.82% and the listing side 2.88%, so 2.5% understates rather than flatters. That is $10,852.50 of gross commission on the median home.
Most agents do not keep all of it. On a 70/30 brokerage split, the agent’s share is $7,596.75, and the advertising is paid out of that.
Now divide. At $223 per connection:
| Your conversion | Connections per closing | Media cost per closing | Left to the agent after media |
|---|---|---|---|
| 1 in 20 (5.0%) | 20 | $4,460 | $3,137 |
| 1 in 34 (2.9%) | 34 | $7,582 | $15 |
| 1 in 50 (2.0%) | 50 | $11,150 | −$3,553 |
| 1 in 75 (1.3%) | 75 | $16,725 | −$9,128 |
Break-even is 1 in 34 for an agent on a 70/30 split — 34 connections is the last rate that still clears, and it clears by $15. An agent keeping the full side commission clears at 1 in 48. In a non-major metro at $139, the same two figures are 1 in 54 and 1 in 78.
Now set that against the benchmark. The Close, in a page last updated 20 May 2026, reports real estate internet lead conversion at 2% to 3% — one closing per 33 to 50 leads. The published major-metro price therefore breaks even somewhere inside the industry’s own conversion band, not comfortably below it.
One qualifier, and it matters. That 2–3% is a widely repeated industry figure, not a measured cohort of Zillow connections specifically, and a connection is a warmer unit than a raw internet lead. Treat the comparison as an order-of-magnitude check, not a verdict. The verdict only comes from your own numbers, which is exactly why the arithmetic is worth running before the contract rather than after it:
Break-even conversion rate = cost per connection ÷ (your side’s commission × your split)
Two costs are missing from that formula on purpose: your hours, and the cost of the deals you did not work because you were working these. A break-even channel that consumes your calendar is a losing channel. If you want the other half of the picture — what a closed client is worth across all the transactions and referrals that follow, not just this one — the customer lifetime value formula is where that side gets computed.
Where a 40% success fee beats paying per connection
Zillow Preferred, described on Zillow’s FAQ as “the next evolution of the Flex program,” inverts the structure: nothing upfront, and 40% of your side’s commission on a seller-originated closing. On the median home that is $4,341 paid to Zillow, once, per deal that actually closes.
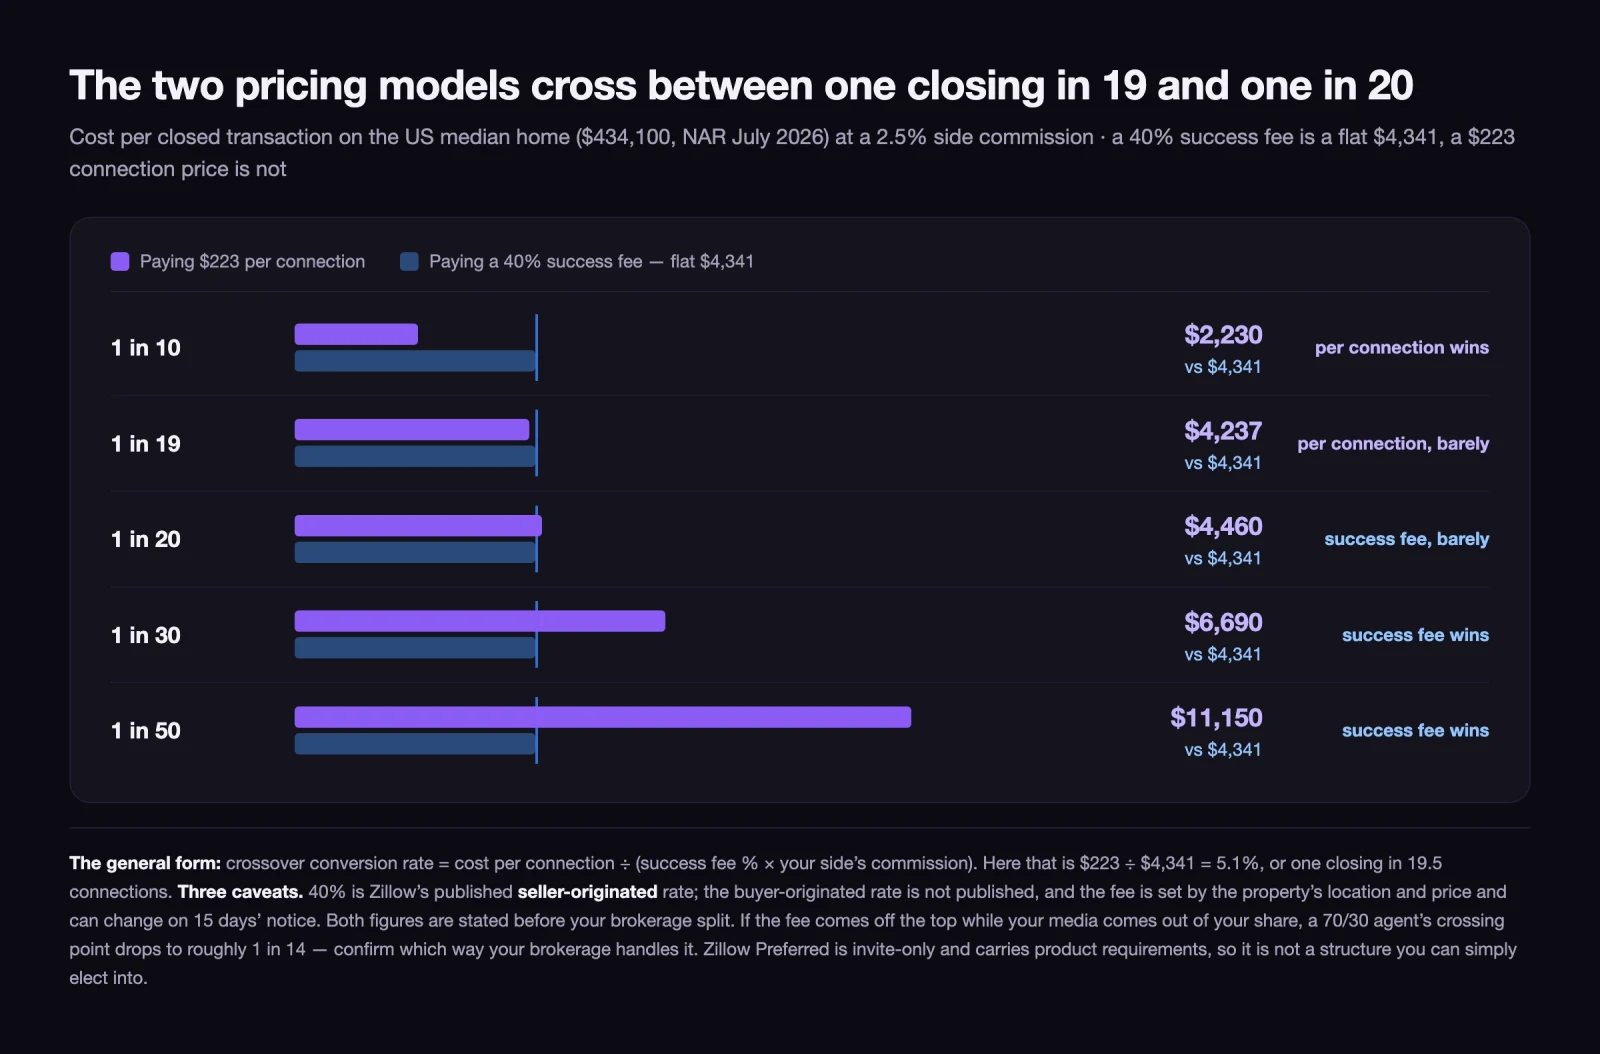
Against a per-connection contract, that is a flat cost per closing versus a variable one. Comparing what the channel extracts per closing — both figures stated before any brokerage split — the two cross at a single conversion rate:
| Your conversion | Cost per closing at $223/connection | Cost per closing at a 40% success fee | Cheaper |
|---|---|---|---|
| 1 in 10 | $2,230 | $4,341 | per connection |
| 1 in 19 | $4,237 | $4,341 | per connection, barely |
| 1 in 20 | $4,460 | $4,341 | success fee, barely |
| 1 in 30 | $6,690 | $4,341 | success fee |
| 1 in 50 | $11,150 | $4,341 | success fee |
The crossover sits between 1 in 19 and 1 in 20. Convert better than that and paying per connection is cheaper. Convert worse — which, on the benchmark above, most agents do — and the success fee is the cheaper of the two, because it charges nothing for the twenty, thirty or fifty conversations that went nowhere.
The general form, so you can run it on your own market rather than the median one:
Crossover conversion rate = cost per connection ÷ (success fee % × your side’s commission)
Three caveats before anyone treats this as a recommendation. First, 40% is the published seller-originated rate; the buyer-originated rate is not published, and Zillow states the fee is determined by the property’s location and price and can change on 15 days’ notice. Second, that crossover compares what the channel extracts, before your split. Who actually bears the success fee moves your own crossing point: if it comes off the top while your media spend comes out of your share, a 70/30 agent’s indifference point drops to roughly 1 in 14. Confirm which way your brokerage handles it before applying the table to yourself. Third, Preferred is invite-only and carries product requirements, including a Follow Up Boss subscription. It is not an option you can simply elect into when the arithmetic favours it.
Performance-based routing: your conversion decides next month’s volume
There is a feedback loop in the Preferred model that a static cost-per-lead calculation cannot see.
Zillow states that Preferred “leverages performance-based routing and ZIP code preferences to prioritize opportunities for top-performing agents and ensure they’re connected with buyers and sellers in areas they’re best positioned to serve.” Zillow adds that it “maintains program standards that all partners are expected to achieve,” and that agents demonstrating strong performance receive a larger share of their market’s connections over time.
From Zillow’s side this is rational — under a success fee, Zillow is only paid when a deal closes, so routing volume toward agents who close is straightforward alignment of interest. From the agent’s side it means the supply of connections is conditional on the conversion you have already produced. Weak months reduce next month’s volume, which spreads the fixed costs of your business over fewer opportunities, which makes the next month harder.
The practical implication is about measurement, not about fairness. If routing is performance-weighted, then a channel review that only looks at cost per lead will read a routing decision as a market change. You need to know which of your connections were genuinely ready to transact and which were early-stage, and that is a qualification question rather than a volume one — the same distinction that separates a marketing-qualified lead from a sales-qualified one. Portal connections arrive labelled by the portal, not by your pipeline.
Putting a portal invoice next to the rest of the pipeline
A portal is one line in a channel mix, and it should be judged the way the other lines are judged: cost to acquire, weeks to a signed deal, and how much of your calendar it eats.
Two comparisons make the invoice legible.
Against the channels you run yourself. The eight non-portal channels — sphere, referral partners, expired listings, open houses, neighbourhood content, paid social, farming and search — carry their own published cost-per-lead figures and their own very different timelines. How to get real estate leads sets them out with the arithmetic shown, including the channel that gets cheaper every year instead of more expensive. Portal spend is best read as the fast, expensive end of that list, not as a replacement for it.
Against buying the same intent directly. A buyer searching on a portal is also searching on Google, and you can bid on that query yourself instead of renting a share of someone else’s page. The trade is control against convenience: you own the landing page, the follow-up and the data, and you also own the work of building them. What Google Ads cost works through that budget in full.
The honest summary is that a portal sells you distribution you did not build, at a price set by how many of your competitors want the same thing. That is a legitimate product with a legitimate price. It becomes a bad purchase only when it is the sole channel, because then the auction sets your cost of acquisition and you have no second number to compare it to.
A five-line test to run before the sales call
Run these before the call, not after it. Every input is either published or already in your CRM.
- Your side’s commission on a median home in your target ZIP. Not the national median — the ZIP’s. Multiply by your split to get what you actually keep.
- Your break-even conversion. Quoted price per connection ÷ the number from line 1. If the result is above 3%, you are betting on beating the industry benchmark from a standing start.
- Your measured conversion on your existing internet leads. From your CRM, over the last twelve months, closings divided by leads. If you cannot produce this number, that is the finding — buy the measurement before you buy the traffic.
- The crossover. Price per connection ÷ (success fee % × your side’s commission). Tells you which of the two structures your actual conversion rate favours.
- Hours per closing. Connections per closing × minutes per connection. A channel that breaks even on money and loses on time is still a loss.
If lines 2 and 3 disagree, the ZIP is not the problem and neither is the price — the follow-up is. If they agree and the answer is still no, the money is better spent on something that keeps producing after you stop paying for it. That is usually the site and the content behind it, which is what our real estate and architecture practice is built around: an asset you own, at a cost per lead that falls over time instead of rising with the auction.
Either way, the decision should come from five lines of arithmetic done in advance — not from a discounted six-month term agreed before the first data point exists.
09 / Reader questions
Frequently asked questions
01How much do Zillow leads cost?
Zillow's own published average is $223 per connection in major metro areas and $139 in non-major metros. Third-party reporting puts the resulting monthly spend at $300–500 in non-metro ZIP codes and $1,000 or more in metro ZIP codes. The older $20–60 per lead band still quoted in search results measures a different unit and a different year, so the two do not reconcile into one number.
02Are Zillow leads worth it?
That depends on one number you can compute before you sign: your conversion rate. At $223 per connection, a median-priced US home and a 2.5% side commission, an agent on a 70/30 brokerage split breaks even at about 1 in 34 connections. The industry benchmark for internet lead conversion is 2–3%, or 1 in 33 to 1 in 50 — which puts the published major-metro price on the line rather than clearly under it.
03How much does Zillow charge at closing?
Zillow's published success fee for Zillow Preferred, the invite-only program that replaced Flex, is 40% of the commission you expect to receive for your side of a seller-originated transaction. The buyer-originated rate is not published on the pricing page; Zillow states the fee is set by the property's location and price, and that it can change on 15 days' notice.
04How do you buy Zillow leads?
You buy advertising share in specific ZIP codes rather than individual leads. Zillow sells Premier Agent advertising by ZIP, prices it by how many agents are bidding there, and splits visibility between them in proportion to spend. Zillow does not publish a rate card — pricing comes from a call with a sales advisor. Zillow states that contracts are not required, and that the term it offers is six months, at a discount.
05Why do Zillow leads cost more in some ZIP codes?
Zillow states the price is driven by market demand in each ZIP code and rises with the number of agents buying advertising there. Home values, competing agent count and overall demand all feed the base cost, so two adjacent ZIP codes with similar houses can price very differently if one has more agents bidding. Zillow also maps ZIP codes to markets using public data that updates without notice.
06Do Zillow leads cost less than Realtor.com leads?
Neither portal publishes a rate card, so any head-to-head price claim is an estimate rather than a quote. The comparison that can be made honestly is structural: both price by geography and competition rather than by lead, so the number that decides which is cheaper for you is your own conversion rate on each, measured over at least one full contract term.